THE FOREX TRENDS
Revealing the World of Forex: Expert Analysis and Secrets of successful trading
In this article, we will discuss Three major bearish candlestick formations and their psychology.
Candlestick patterns play a vital role in Forex trading, offering traders valuable insights into market sentiment and potential price movements. Among these patterns, bearish candlestick patterns are particularly significant for identifying possible reversals or shifts in the prevailing uptrend. In this discussion, we'll delve into three major bearish candlestick formations and their psychology that traders frequently rely on to make informed decisions in the Forex market.
The three major bearish candlestick patterns are mentioned below
These formations will appear in a downtrend as well as in an uptrend, but they are a great value and offer great financial returns if spotted and traded in a downtrend. It is imperative to note that as the market moves sideways in a 20 to 40 pips trading range, the market may form all kinds of bullish and bearish candlestick patterns, which should be overlooked. You should also remember not to trade these candlestick formations in small consolidated or sideways movements.
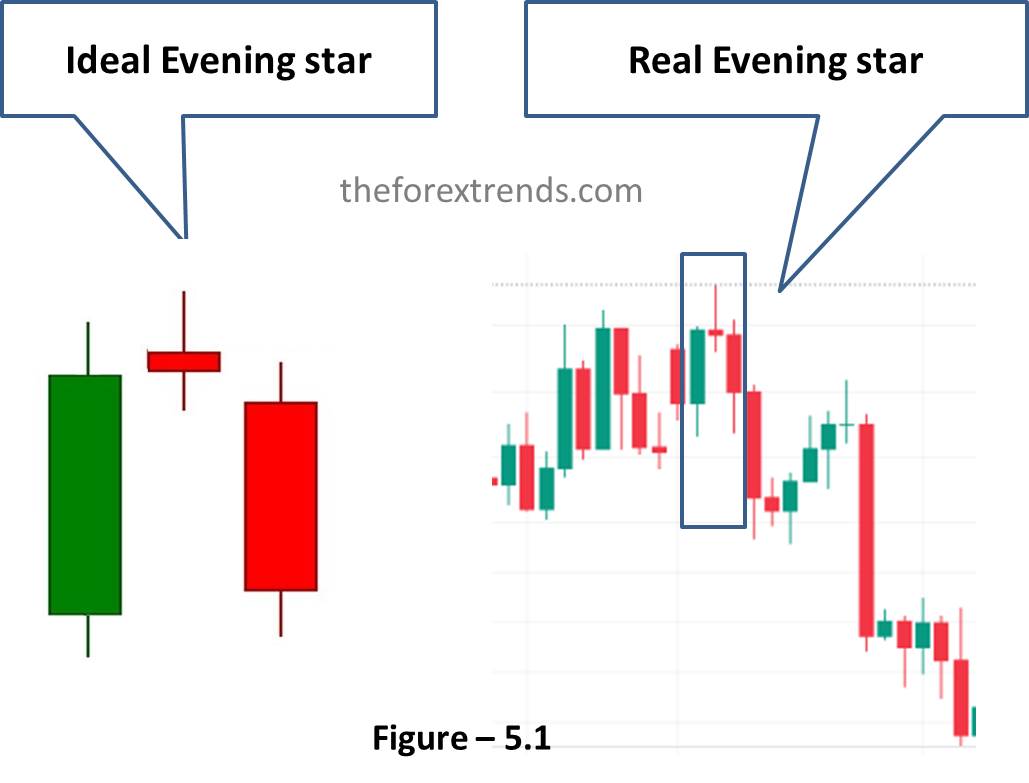
It is important to note that it starts out with a bullish decision candle, followed by perhaps one, two, three even four indecision candles before the decision bearish candle appears.
An evening star forms when you have a large bullish decision candle, followed by one or more indecision candles, which are followed by a bearish decision candle that closes beyond the 60 percent mark of the beginning bullish decision candle as you can see in Figure 5.1. It signifies a strong sell signal. If the last bearish candle closes above the halfway point of the first bullish candle of the formation, it is a sign of continued bullish sentiment.

Understanding the psychology behind the Evening Star pattern is crucial for Forex traders:
The first candle represents optimism among traders. It reflects a continuation of the current uptrend, with buyers dominating the market. Traders holding long positions are still confident.
The small-bodied candle on the second day signifies uncertainty and indecision in the market. Traders are no longer as confident as they were on the first day. This is often a sign that the uptrend might be losing steam.
The third candle, which is a strong bearish candle, indicates a shift in sentiment. Sellers have taken control, and the price has dropped significantly, closing below the first candle's opening. Traders who were holding long positions may start to exit or consider shorting the currency pair.
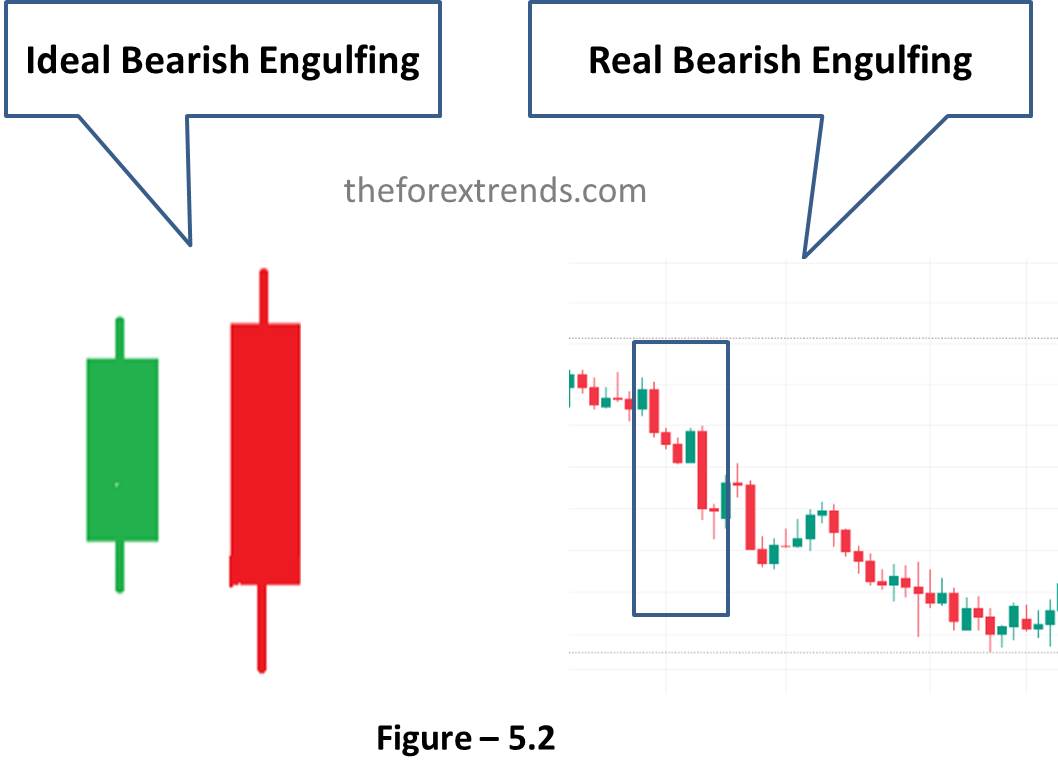
This pattern is considered one of the more reliable reversal signals. It suggests a shift from bullish sentiment to bearish sentiment. It can also be the turning point or end of the retracement in a downtrend. As prices continue to rally and the charts form small decision bullish candles all of a sudden, a very large strong bearish candle appears and literally engulfs the previous one to three bullish candles as shown in Figure 5.2. This formation occurs when the open of the bearish engulfing candle opens higher than the close of the previous bullish decision candles and engulfs several previous bullish candles. This is a strong sign of a reversal when the bears are taking control.

Understanding the psychology of traders involved in this pattern is key:
The first candle represents a continuation of the bullish sentiment. Traders are optimistic, and those holding long positions are confident that the price will continue to rise.
The appearance of the second bearish candle signals a sudden and dramatic shift in market sentiment. It opens above the high of the previous day, which may attract more buyers initially. However, as the day progresses, sellers gain control, and the price drops significantly, closing below the low of the previous day. This abrupt reversal can shake the confidence of bullish traders and attract bearish traders.
The larger the second candle and the more pronounced the engulfing, the stronger the bearish signal. To confirm the pattern, traders may also look for additional indicators such as overbought conditions on oscillators like the Relative Strength Index (RSI) or bearish divergence.
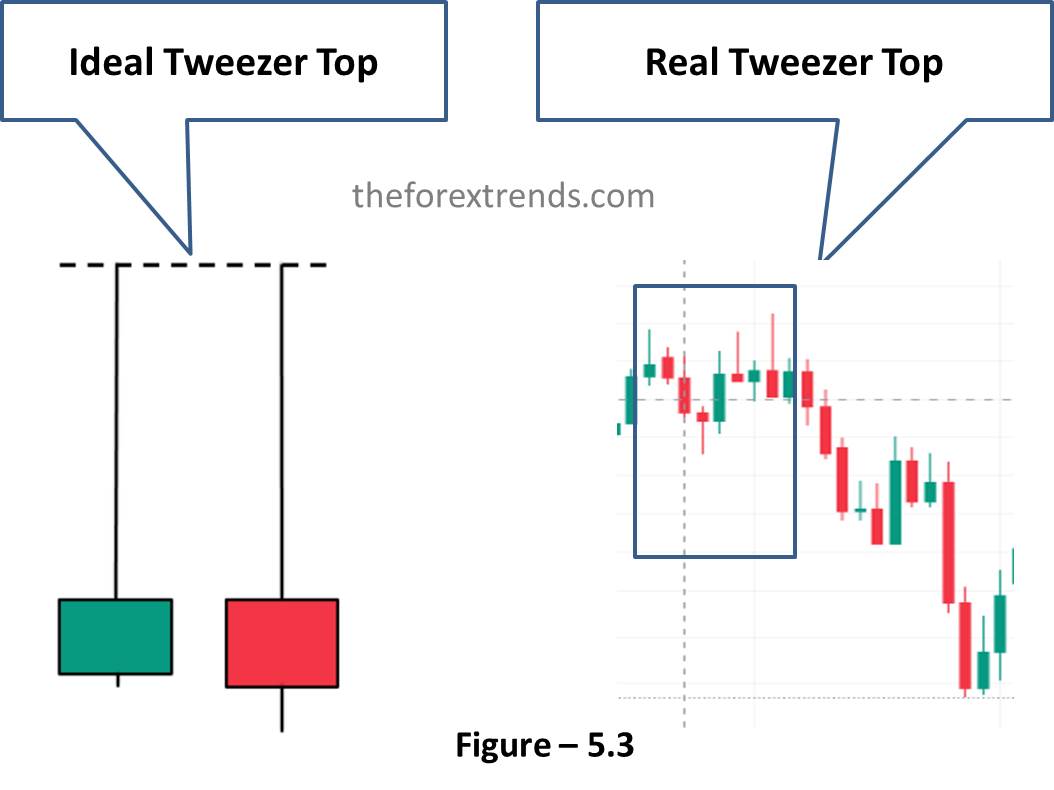
As you see in Figure 5.3 below, the market has been rallying, but a clear decision has been made by the bears to take over, observed via the formation of Tweezer tops. As the market was moving up, bullish candles were forming. Then all of a sudden, an indecision candle appears, which means more bears have stepped in and started selling.
A Tweezer top formation starts out with a bullish decision candle, followed by perhaps one, two, three, or even four indecision candles. These indecision candles have long wicks on the upper side. The highs of the two indecision candles, usually at the same price or within a couple of pips difference, now create a new level of resistance. Tweezer top indicates that this is the end of this uptrend move and the market is now getting ready to go dip, If you want to make a profit in this next dip need to start selling after identifying this formation.

Understanding the psychology of traders involved in this pattern is crucial:
The first candle represents a continuation of the bullish sentiment. Traders holding long positions are optimistic and expect the upward trend to persist.
The appearance of the second bearish candle at the same level as the previous day's high suggests that despite initial attempts by buyers to push the price higher, they were ultimately unsuccessful. The bearish close of the second candle signifies that sellers have gained control, potentially shaking the confidence of bullish traders.
It's essential to confirm the pattern with other technical indicators or analysis methods to reduce the risk of false signals. Traders may use oscillators like the Relative Strength Index (RSI) or Moving Averages to support their decision.
I hope this article is helpful for you to understand the Three major bearish candlestick formations and their psychology
Stay tuned to our website for more tutorials about Forex Market. If you have any suggestions or queries, feel free to Contact us or drop your message in the comment section below.
Comments