THE FOREX TRENDS
Revealing the World of Forex: Expert Analysis and Secrets of successful trading
In this article, we will discuss Three major bullish candlestick formations and their psychology.
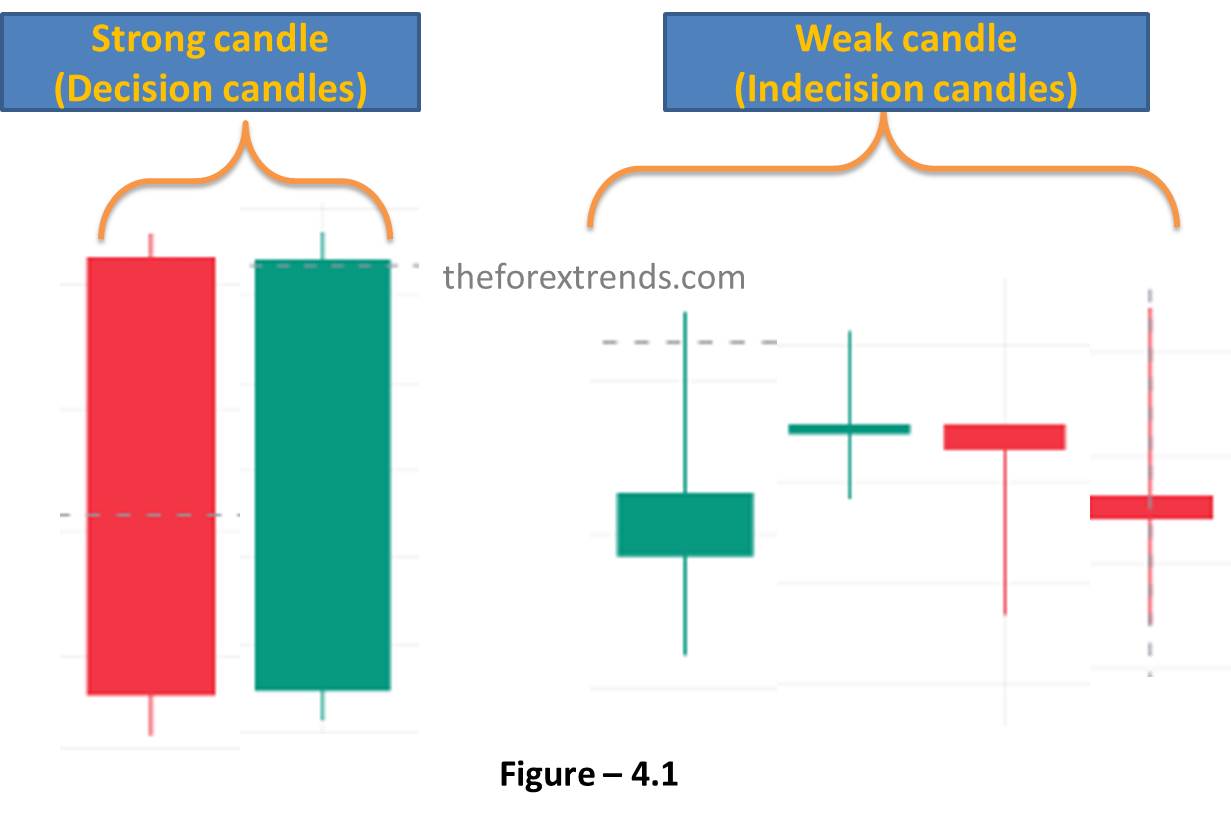
The market can only move in three directions, upwards, downwards, and sideways. When the market moves in any direction, the candlestick formations provide us with a visual sign that monitors the strength or weakness of the market in a certain direction. Full-bodied bullish or bearish candles with relatively small wicks on either side are a sign of solid price movement. With small bodies and, in some cases, no bodies at all, where the open and the close were at the same price with large wicks on either side or on both sides is a sign of weakness of the movement. Refer to Figure 4.1 for recognizing both candles.

As the market moves in a direction on a wave, it creates some candlestick formations. Traders recognize those formations and execute their trades according to the psychology of those formations. The formations communicate when it is time to get in and when it is time to get out. When there are more buyers than sellers, the market begins to rally, when there are more sellers than buyers the market begins to dip, and when there are equal numbers of buyers and sellers, the market moves sideways.
Let’s learn the 3 major bullish formations or Buy signals for traders. Even though there are many candlestick formations and patterns these three major bullish patterns offer great buy signals. These three major bullish candlestick patterns are:
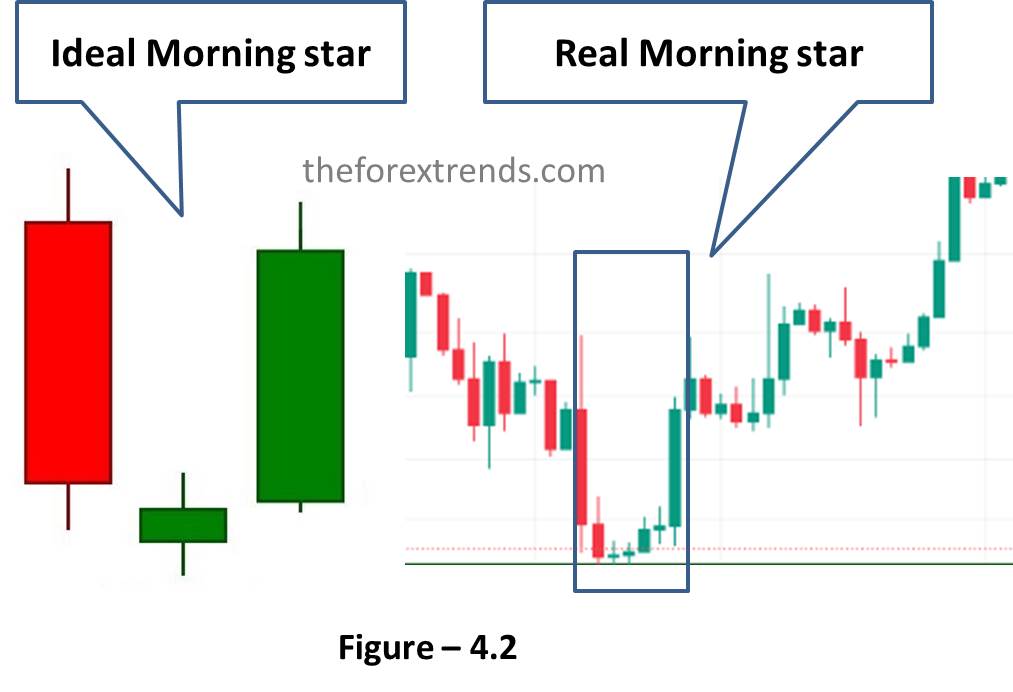
In the formation of morning stars, it starts out with a bearish decision candle, followed by 1,2,3, or even 4 indecision candles before the decision bullish candle appears as you see in Figure 4.2. Generally, a morning star appears at the bottom of the chart, signifying the end of the recent downward movement. A morning star forms when you have a large body bearish candle followed by single or multiple indecision candles, which are followed by a large body bullish candle that closes beyond the 60 percent mark, or beyond the top half of the beginning bearish candle.

The Psychology behind the Morning Star is, that bears are losing control and traders are no longer selling when you find a Morning Star. More bulls have come into the market, which creates an equal number of buyers and sellers. At last more buyers step in and take control of the marker. The final bullish candle of the formation sends ripples of greed throughout the trading community and a major rally takes place, especially when accompanied by significant volume.
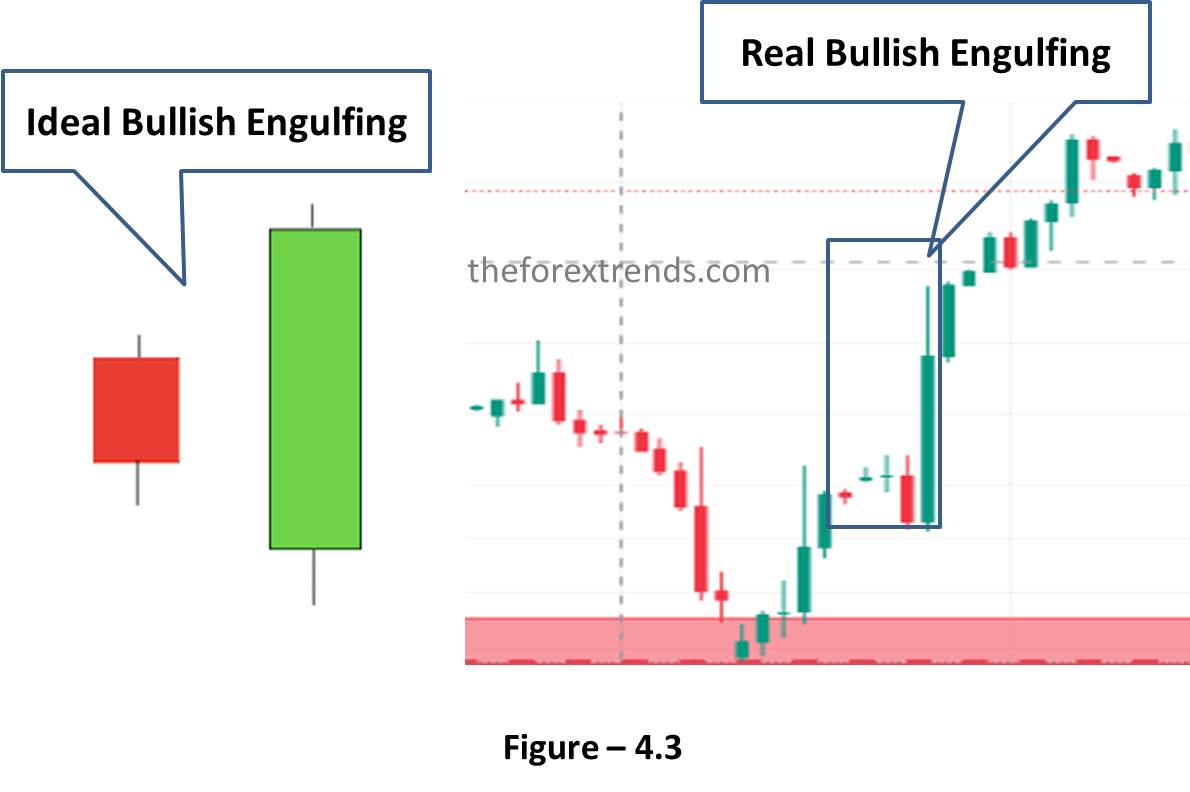
These candlestick formations often signify the end of the downtrend or a reversal. This formation can also be the end of the retracement in an uptrend. A bullish engulfing candle is formed when the candle opens lower than the close of the previous bearish large-body candle and engulfs the previous two or three bearish candles. This is a strong sign of buy because buyers are clearly taking control as you see in Figure 4.3.

The Psychology behind this formation is, that traders with sell positions make a quick dash to cover their exposure, and their rush to exit their positions adds power to create this formation. This formation indicates a shift from a bearish to a bullish trend. The pattern suggests that buyers have overwhelmed the sellers, leading to a potential change in market sentiment. The abrupt shift in price action from a downtrend to a bullish rally indicates a sudden change in market sentiment. This can attract more buyers and create positive momentum. The pattern emphasizes the importance of the second candle's price action, showing that buyers are stepping in with significant force, overtaking the sellers.
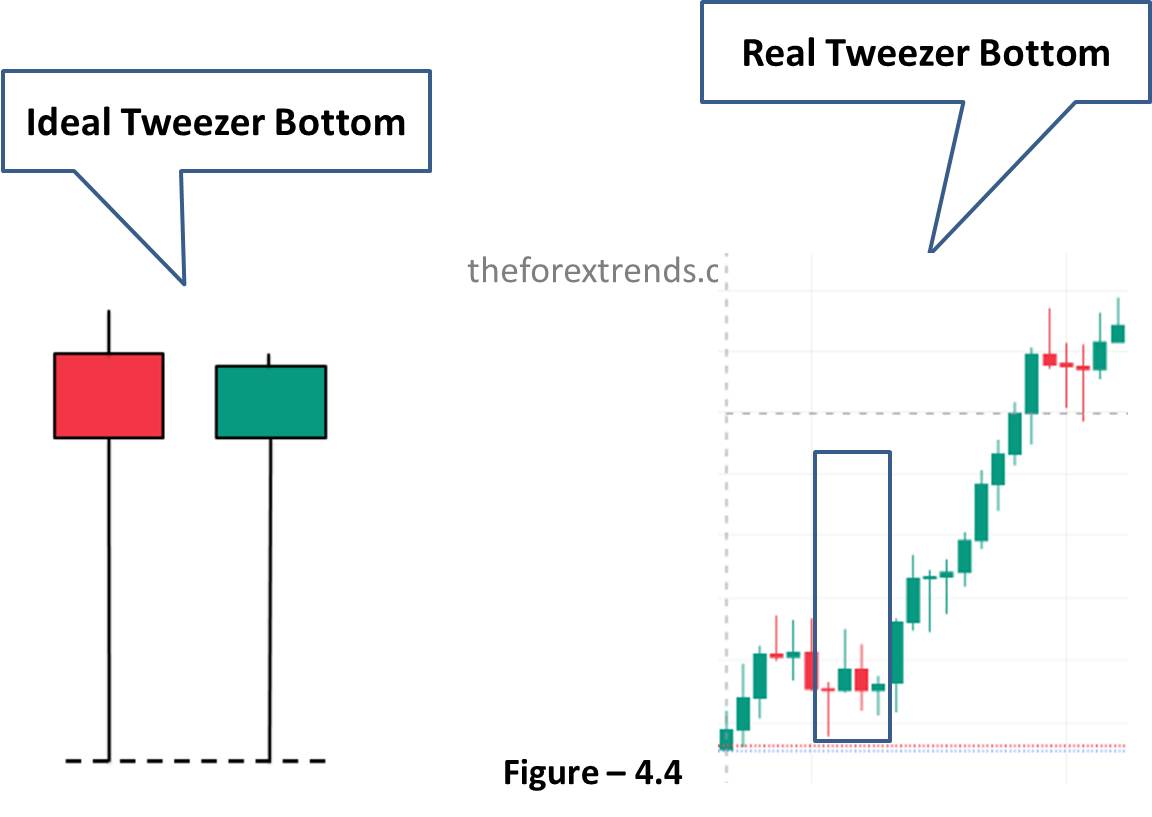
The Tweezer bottom bullish formation is a candlestick pattern that indicates a potential reversal of a downtrend and suggests that a bullish move could be forthcoming. These formations will form when bears lose control and bulls step in and create an environment of equal buyers and equal sellers, which forms two or more indecision candles. A Tweezer bottom formation starts with a bearish decision candle, followed by perhaps one, two, three even four indecision candles, as seen in Figure 4.4. The lows of the two candles as you can see in the below image are usually at the same price or within a couple of pips difference which now creates a new level of support.

The Psychology behind this formation is, the bears have created lower prices, which have been tested, and new buyers have entered the market. As traders note more bullish participation, a rally is implied. Several attempts for lower prices failed, as evidenced by the long wicks on the lower side of the small-bodied candles.
Traders and investors often make decisions based on fear and greed. In a downtrend, fear may drive many to sell, while in a Tweezer bottom scenario, the potential reversal can trigger a shift from fear to greed. As traders anticipate a potential uptrend, they may start buying in anticipation of higher prices, further reinforcing the reversal.
It's important to note that while three major bullish candlestick formations and their psychology can provide insights into potential price movements, they are not foolproof indicators. The market is influenced by a wide range of factors, including fundamental news, economic data releases, geopolitical events, and overall market sentiment. Traders should use such candlestick formations as part of a comprehensive trading strategy, combining them with other forms of analysis and risk management techniques.
I hope this article is helpful for you to understand the Three major bullish candlestick formations and their psychology.
Stay tuned to our website for more tutorials about Forex Market. If you have any suggestions or queries, feel free to Contact us or drop your message in the comment section below.
Comments