THE FOREX TRENDS
Revealing the World of Forex: Expert Analysis and Secrets of successful trading
The Eurozone's Core CPI Flash Estimate for July 2024 reported an annual increase of 2.9%, surpassing expectations of 2.8% and matching the previous month's rate. Excluding volatile items like food, energy, alcohol, and tobacco, this indicator provides crucial insights into underlying inflation trends in the Eurozone. The steady inflation rate supports the euro, indicating moderate inflationary pressures. In contrast, the US is experiencing a decrease in the Consumer Price Index, reducing expectations for additional Federal Reserve rate hikes and favoring market sentiment. There is speculation that European interest rates may need to be raised further or held steady for a longer duration, contrasting with potential rate cuts anticipated in the US, which could weaken the US dollar and strengthen the EUR/USD exchange rate in the coming quarters.
EUR/USD remains bearish below the 1.1430 level. A breakout above this trend line could signal buying opportunities up to 1.2398, the last resistance within the monthly structure.
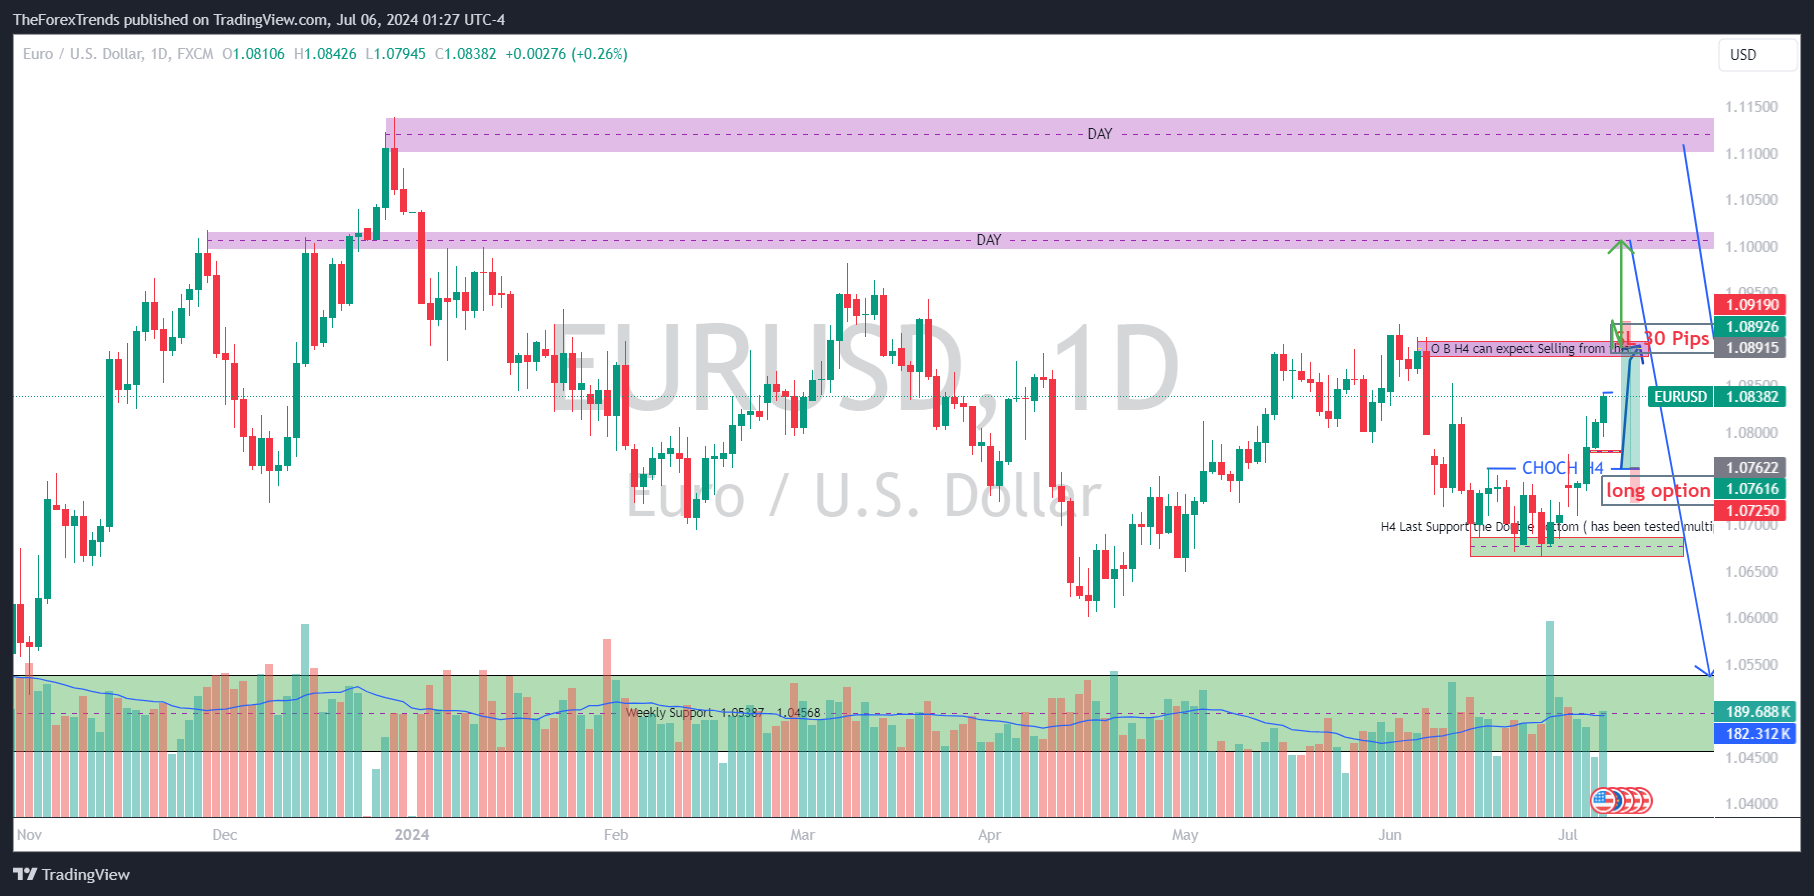
The weekly chart indicates a bullish trend since the rebound from 1.019, targeting levels up to 1.1265 and potentially extending to 1.150. Key supports are noted around 1.0538 - 1.0456, with a shift to bearish bias expected if these levels are breached. Currently, the pair is trading within a range-bound area with a bullish bias.
On the daily timeframe, EUR/USD shows a bearish outlook below 1.1138, marked by a double top formation and 1.004 as the QML (Quasimodo level). Sellers may target intraday opportunities down to the weekly support near 1.050 based on price action at these critical levels.

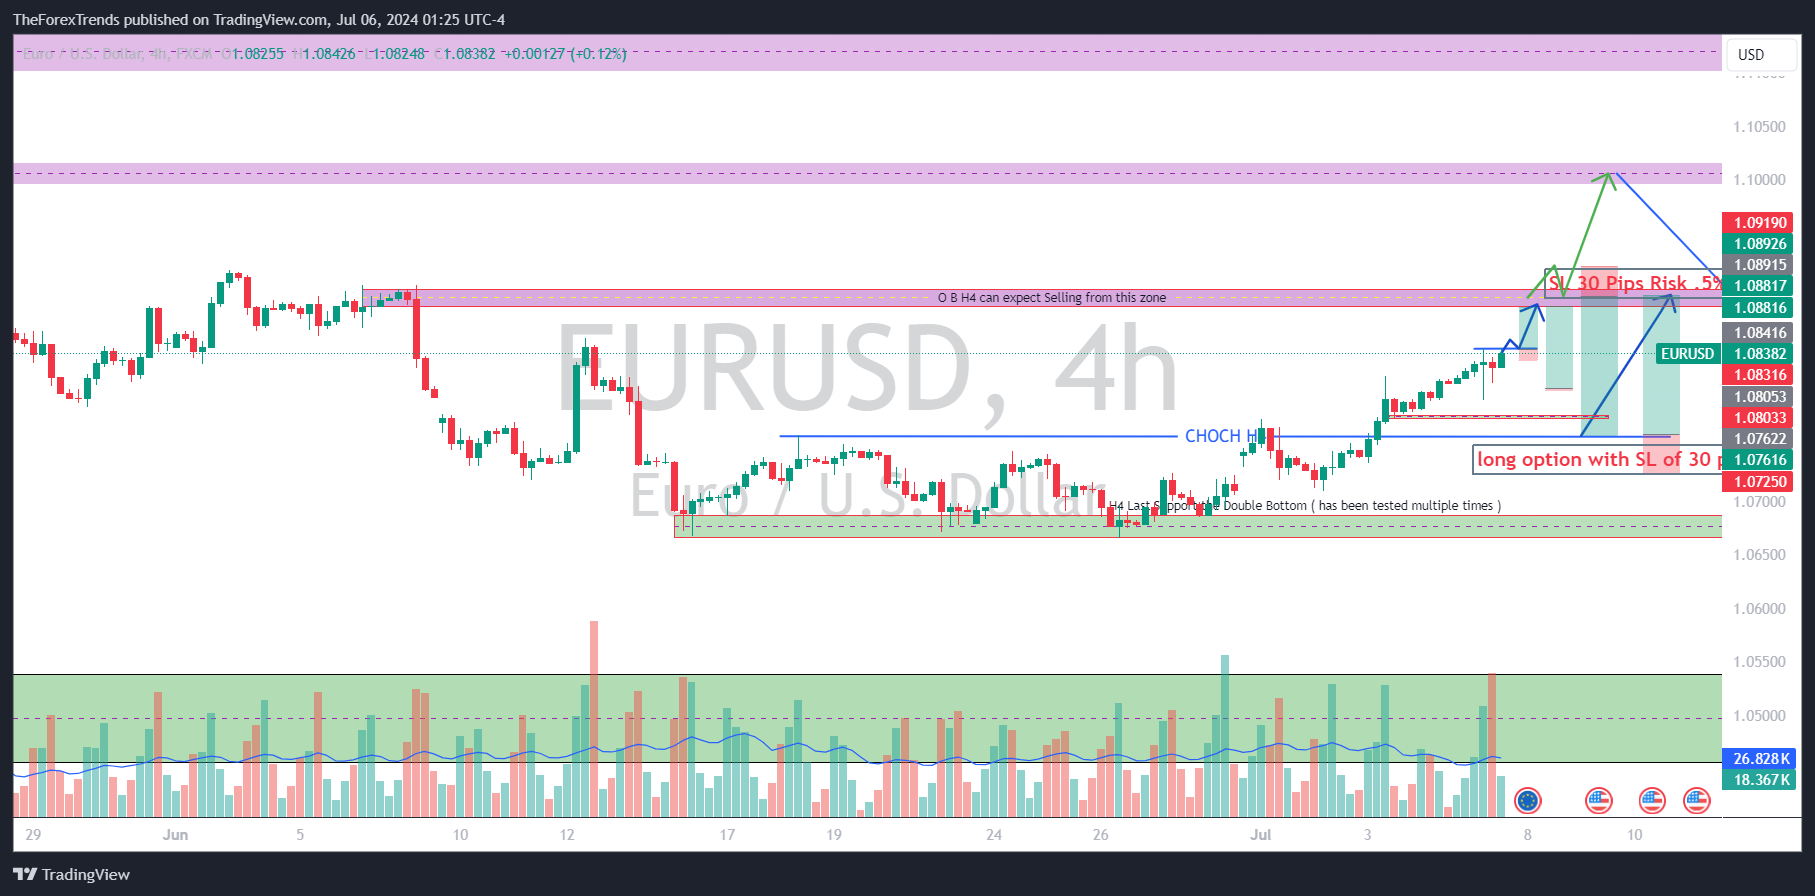
Despite being overbought, the H4 timeframe suggests a bullish trend post-breakout above 1.0760. Short-term traders may consider buying opportunities from this level towards the zone of 1.0880 - 1.0890, aligning with the H4 QML.

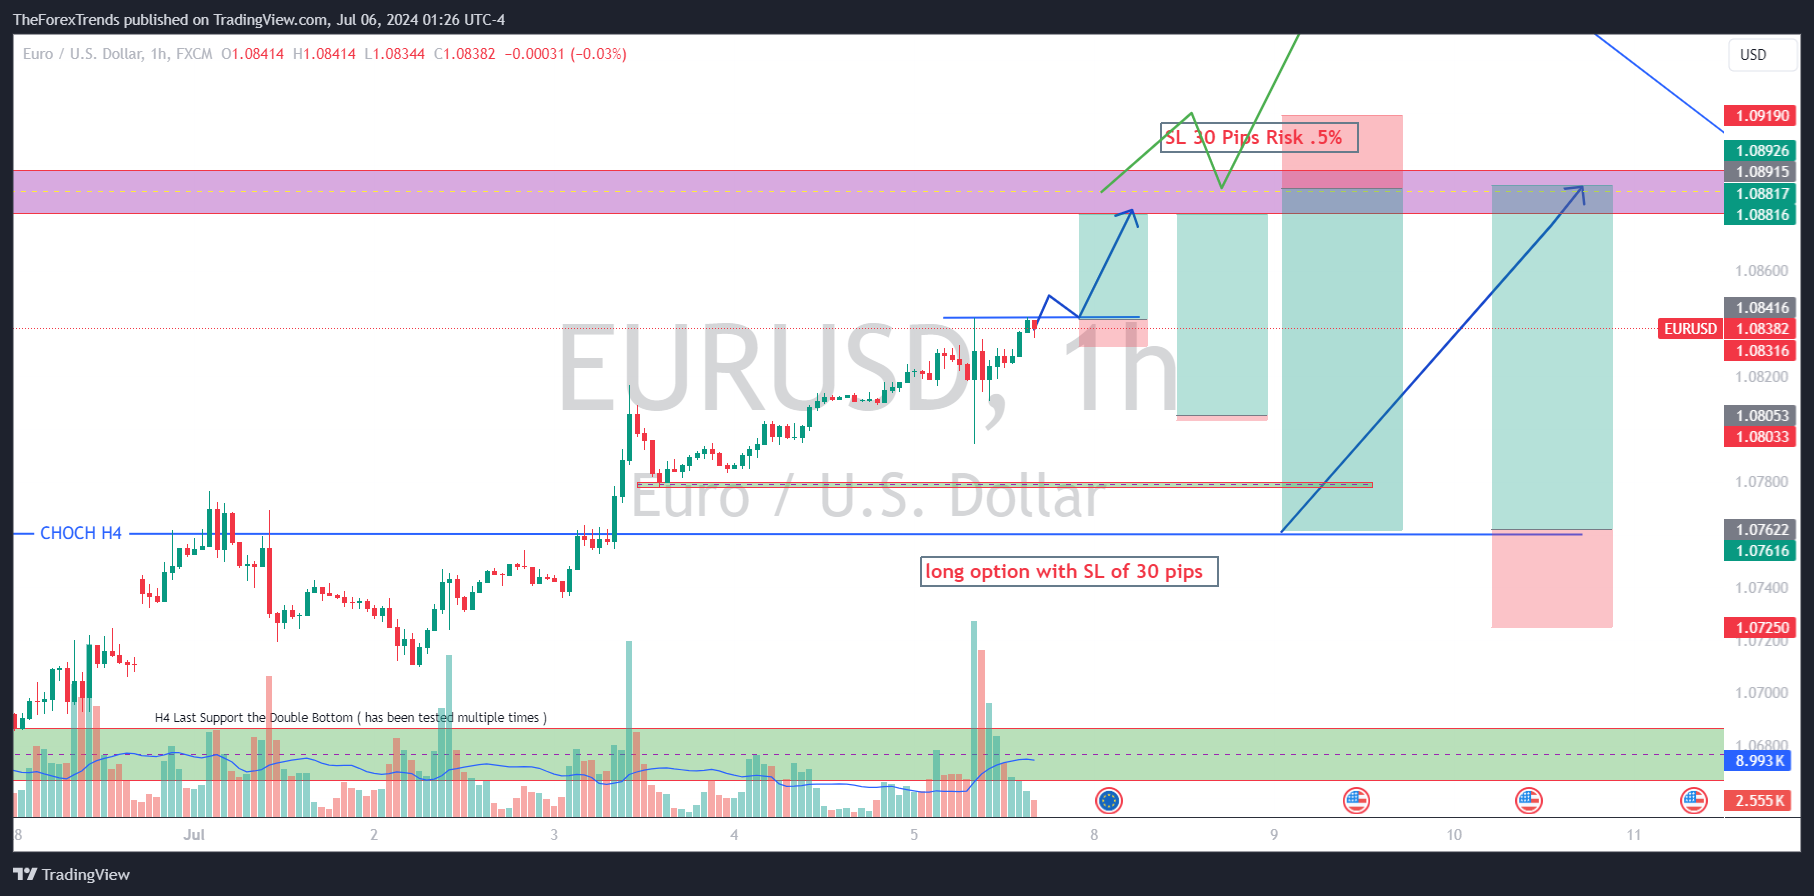
The H1 chart shows a clear bullish trend with significant resistance at 1.0891. Scalping strategies could initiate buy positions above 1.08423 on breakout and retest, targeting gains of 40 pips with a 10-pip stop loss at 1.08316, reflecting a 1:4 risk-reward ratio. Another setup could involve buying from 1.0805 (Fibonacci .78 level) with a 20-pip stop loss and a 1:3 risk-reward ratio, anticipating further upside momentum on a break above 1.0890.

Conclusion
EUR/USD is currently influenced by contrasting inflationary trends between the Eurozone and the US, with the Euro showing resilience supported by steady inflation rates. Technical charts across multiple timeframes suggest potential bullish movements, particularly on breaks above key resistance levels. Traders should monitor geopolitical developments, economic indicators and price action closely for potential shifts in market sentiment and volatility
This analysis provides a comprehensive outlook on EUR/USD. It's essential to perform your own analysis and practice on a demo account before engaging in live trading. The market can be unpredictable, and proper preparation is crucial for success.
Stay updated with our latest analyses and insights into the Forex market. If you have any questions or suggestions, feel free to contact us or leave a comment below.
Comments