THE FOREX TRENDS
Revealing the World of Forex: Expert Analysis and Secrets of successful trading
Recently, there has been widespread speculation in the USA about whether President Joe Biden will participate in the next presidential election. Addressing these rumors, President Biden informed congressional Democrats via a letter that he remains committed to his reelection campaign despite concerns about his mental fitness and campaign viability. He stated, "I want you to know that despite all the speculation in the press and elsewhere, I am firmly committed to staying in this race, to running this race to the end, and to beating Donald Trump."
Under Joe Biden's administration, the sentiment around the US Dollar has consistently remained strong.
On the economic front, recent inflation data from the US showed mixed results, aligning closely with market expectations:
Market Implications
Based on these fundamentals, we anticipate a range-bound market within a specific price range for the DXY (US Dollar Index) until September FOMC.
Gold Monthly Analysis: Indecision Signals from Doji Candle
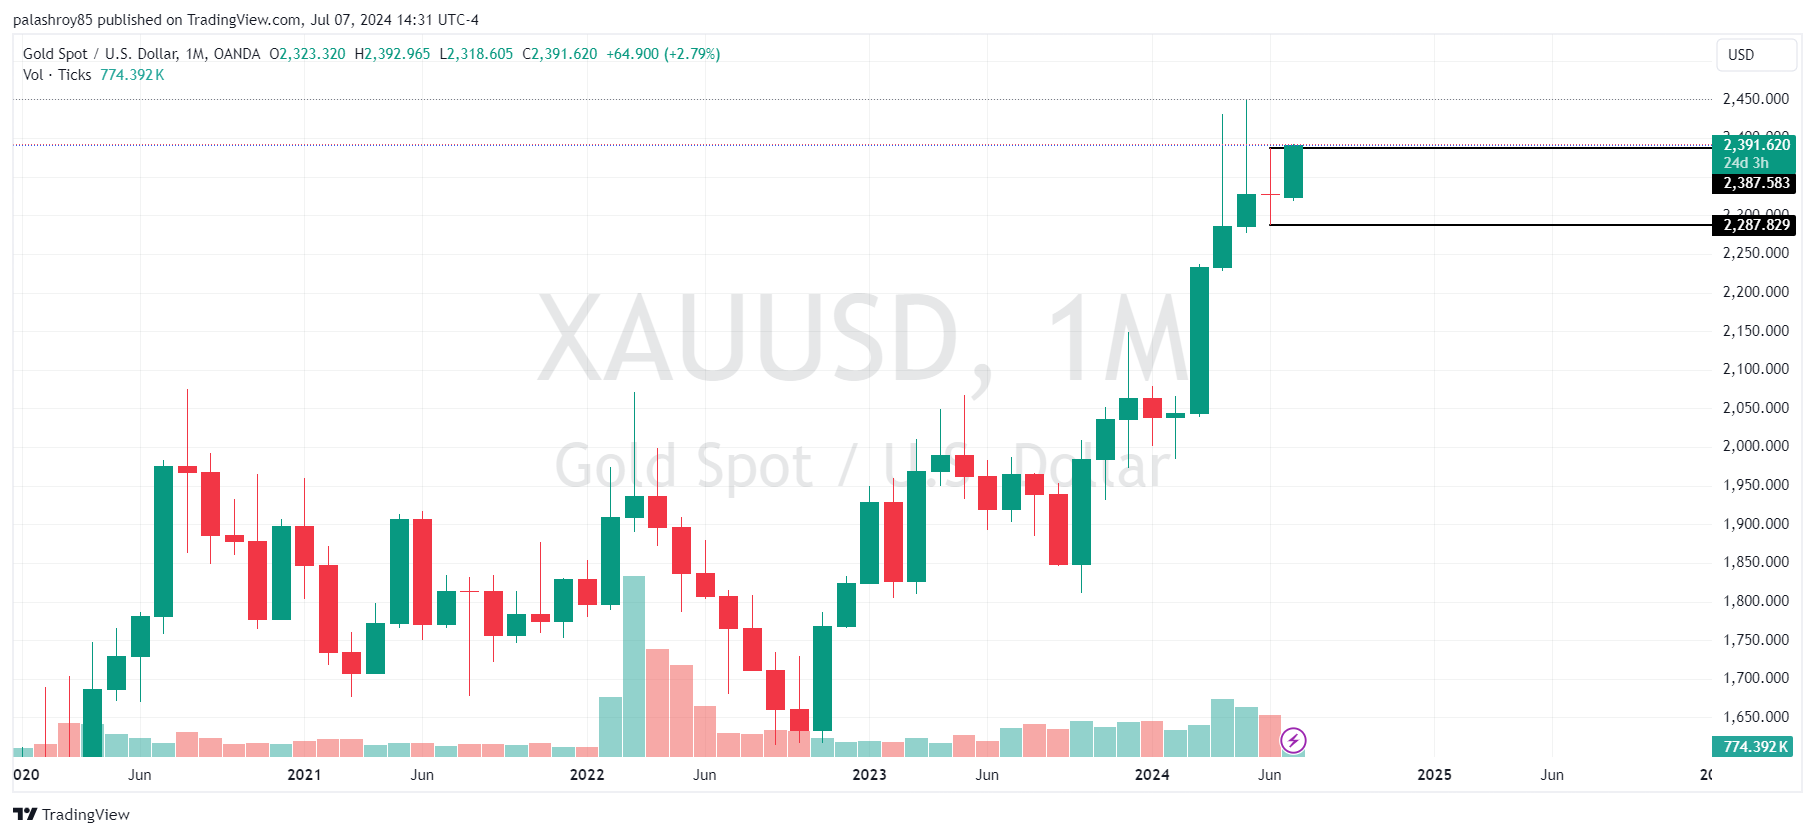
When we analyze gold on the monthly chart, it shows weakness over the past three months, with strong resistance at the 2440-2450 level. The previous month's candle is an indecision or Doji candle. According to my strategy, I mark the high and low of the Doji candle. After a breakout above the high or below the low, the market usually finds a clear direction.
If the price closes above the previous month's Doji candle’s high of 2387.5 and sustained at the end of the month, we can expect a bullish trend again. Conversely, if the price closes below the Doji candle's low of 2287.82, a bearish trend is likely. This strategy is effective for swing trading or positional trading purposes as it is based on the monthly timeframe.

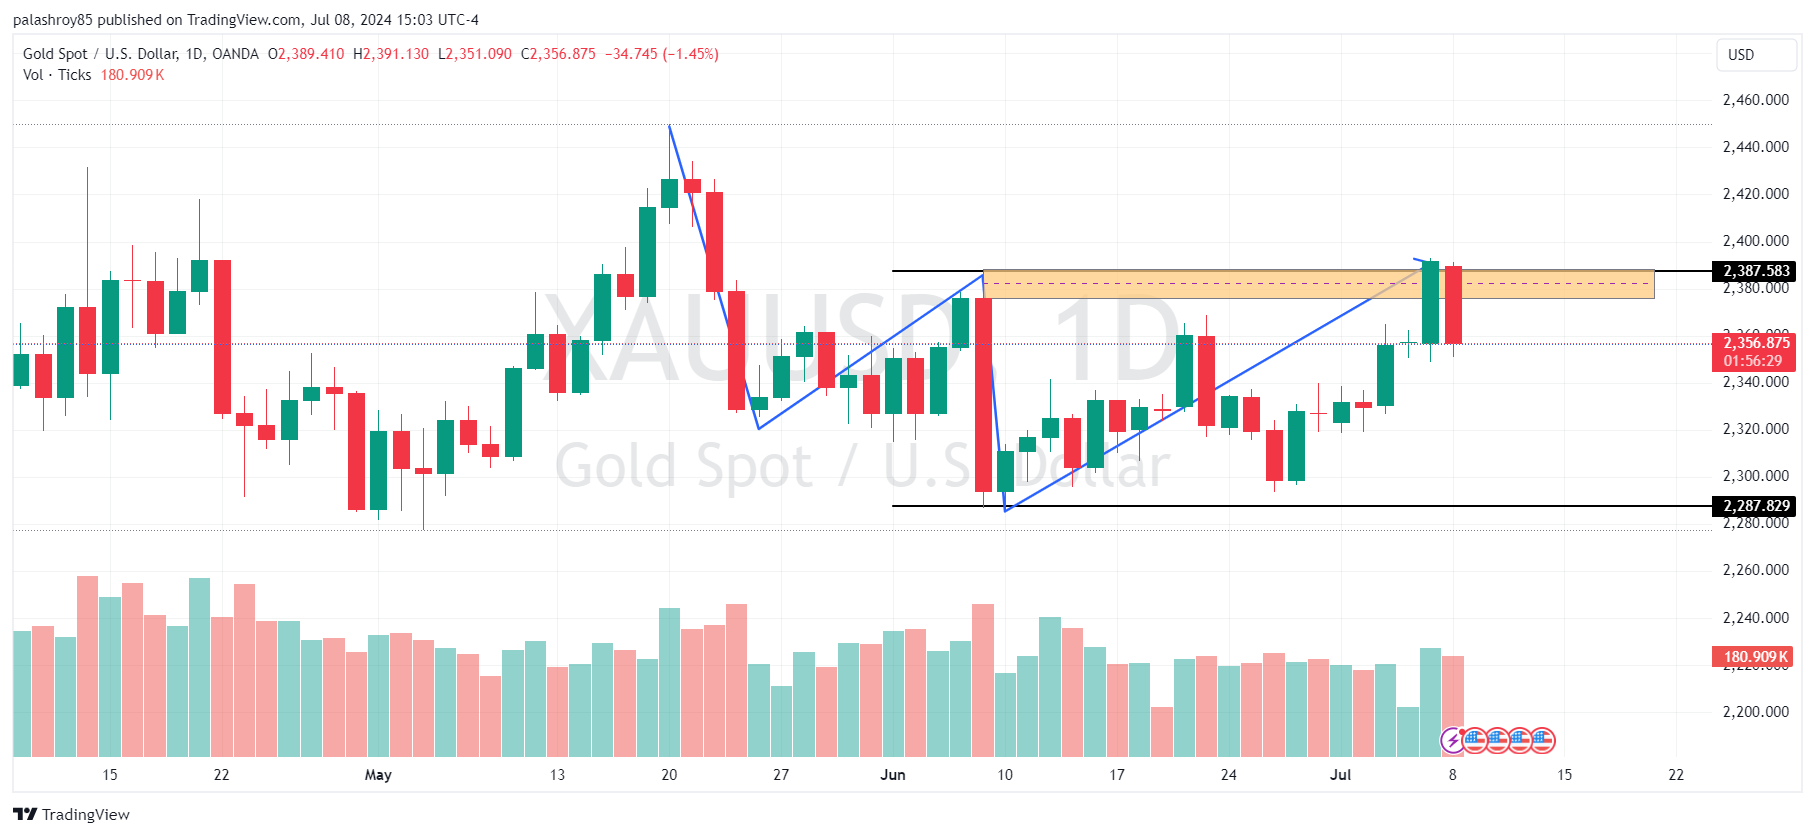
Analyzing gold on the daily frame, the market shows a bearish structure, characterized by lower lows and lower highs. According to this structure, 2387.58 is the last resistance and our Point of Interest (POI), where we can expect a potential sell in gold.
As you can see, the previous day's candle was strongly bearish, and the price is moving down after rejecting the daily structural resistance. Therefore, unless the market closes with two consecutive candles above this resistance, we may see a strong sell-off in gold down to the 2287.82 level. For intraday trading purposes, we will now analyze the smaller time frames.

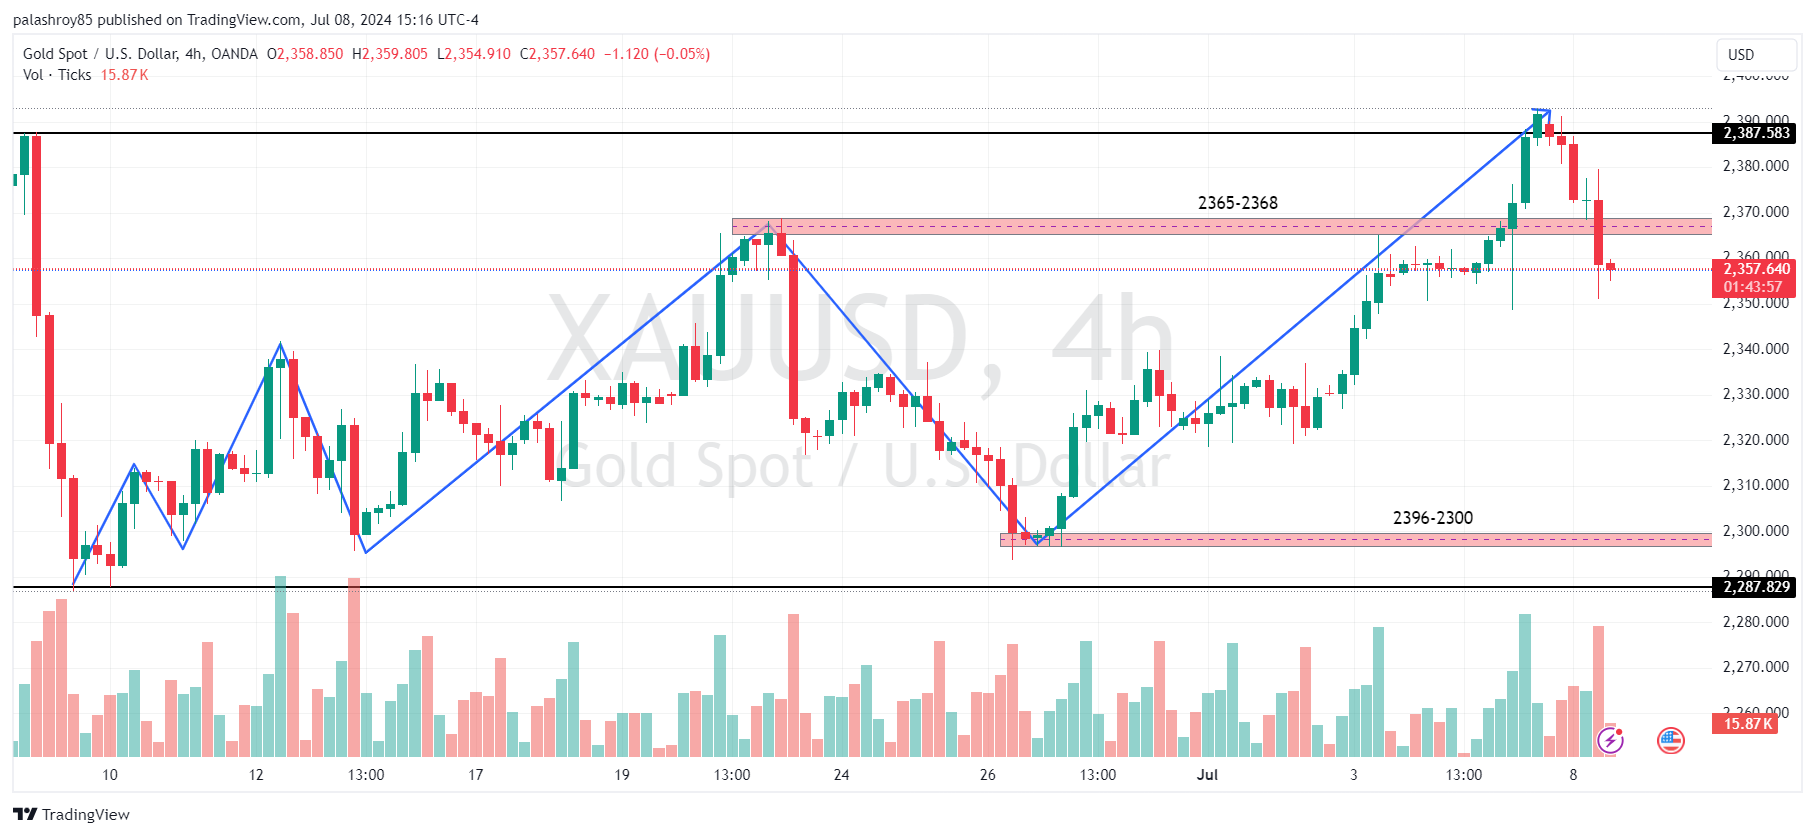
Analyzing gold on the 4-hour frame, we see that the market structure is strongly bullish. According to the recent market structure, we have two Points of Interest (POI) to join the existing trend. The first POI is at the 2365-2368 level. Yesterday, the market retraced approximately 100 pips from this first POI but eventually broke this support and continued downward.
Given the 4-hour structure, our second POI is at the 2296-2300 level. Since the price has broken the first POI, we may see it drop to the last 4-hour structural support at the 2296-2300 level. If the price reaches this level, we can look for a buying opportunity after confirming evidence.
On the other hand, the 2296-2300 level is also our last structural support. If the price breaks this support with momentum candles, we may see another significant sell-off in gold for the long term.

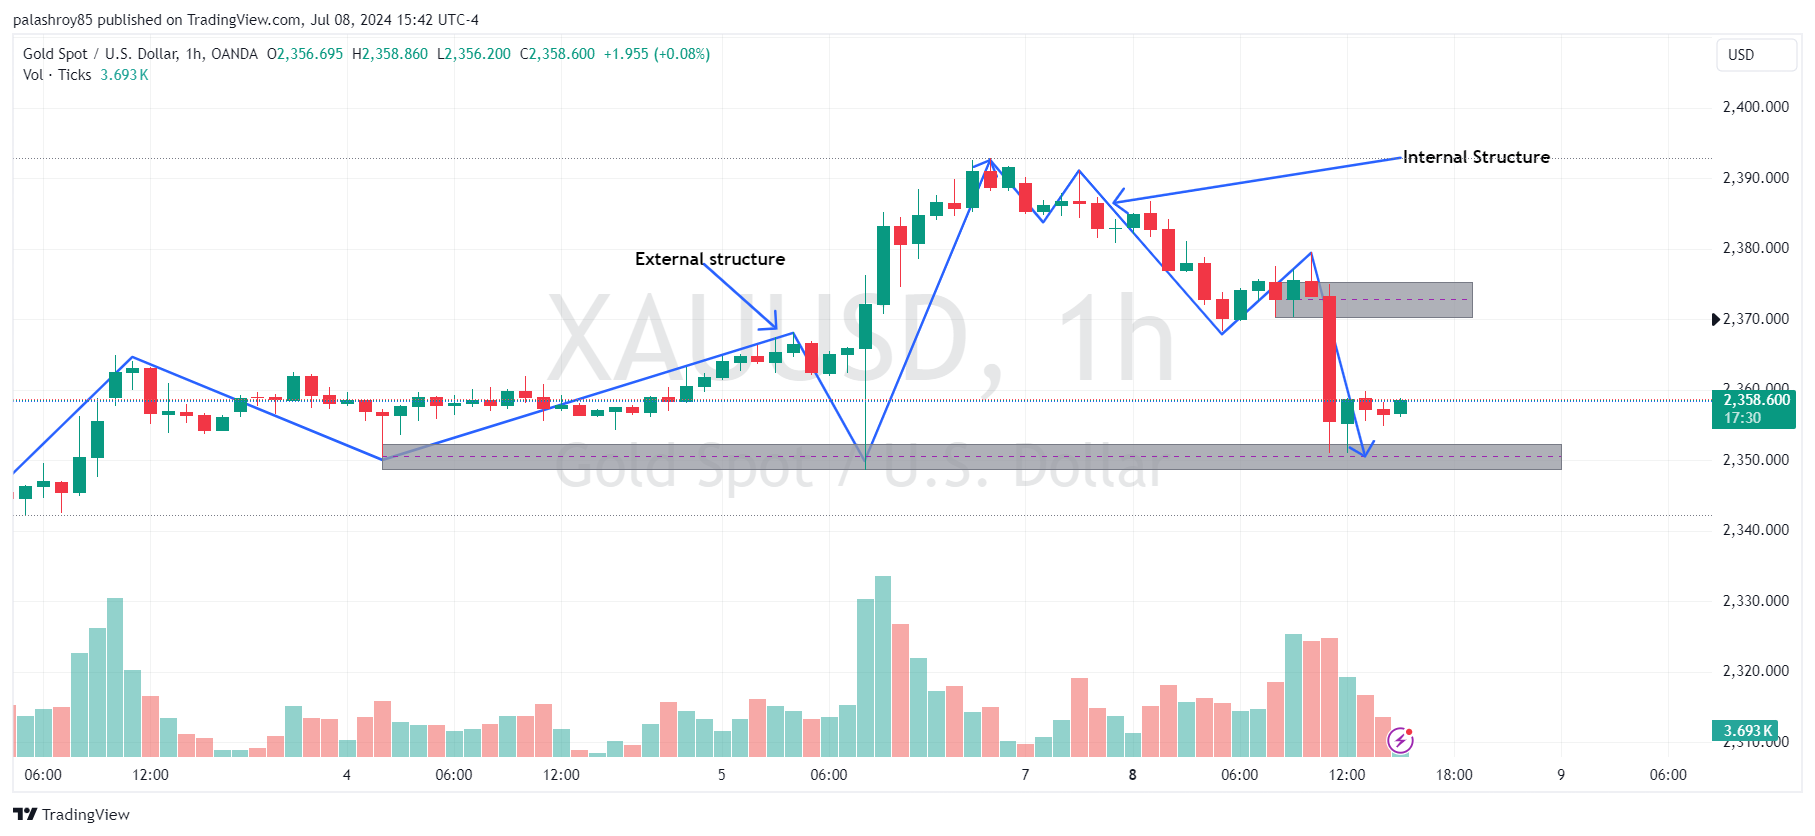
Analyzing gold on the 1-hour frame, you can see that the market structure is bullish. However, if we mark the internal structure against the external structure, you'll notice that the price has made five bearish waves against the external structure.
As we know from the rule of advanced market structure and the Smart Money Concept (SMC), whenever the price makes five waves against the external structure, we shift our sentiment according to the internal structure. In this scenario, gold is now bearish.
Based on the sentiment in the 1-hour frame, if we want to initiate a sell in gold, our first order block and POI (Point of Interest) is in the 2370-2375 zone. If the price reaches this zone, we may initiate a sell from here after getting any selling evidence for intraday purposes.
On the other hand, as mentioned in my previous analysis, the 2355 level was a good support to initiate a buy. According to the previous analysis, this support is still intact. If the price again reaches the 2350-2353 range, we can look for a buying opportunity before today's New York session, with a target of 2370.

This analysis provides a comprehensive outlook on XAUUSD, combining technical insights with upcoming economic data. It's essential to perform your own analysis and practice on a demo account before engaging in live trading. The market can be unpredictable, and proper preparation is crucial for success.
Stay updated with our latest analyses and insights into the Forex market. If you have any questions or suggestions, feel free to contact us or leave a comment below.
Comments