THE FOREX TRENDS
Revealing the World of Forex: Expert Analysis and Secrets of successful trading
Yesterday at 7:00 PM IST, FED Chair Jerome Powell released a speech in which he mentioned that the latest inflation reading suggests a disinflation path. On the other hand, regarding the labor market, he stated, "If the labor market unexpectedly weakens, that would also cause us to react." He also added that they are "well aware of the risk of going too soon and too late."
This means that FED Chair Powell has time to consider a rate cut. All these statements indicate that the FED is not in a hurry to cut rates. However, if the labor market becomes excessively hot, they may need to consider a rate cut sooner.
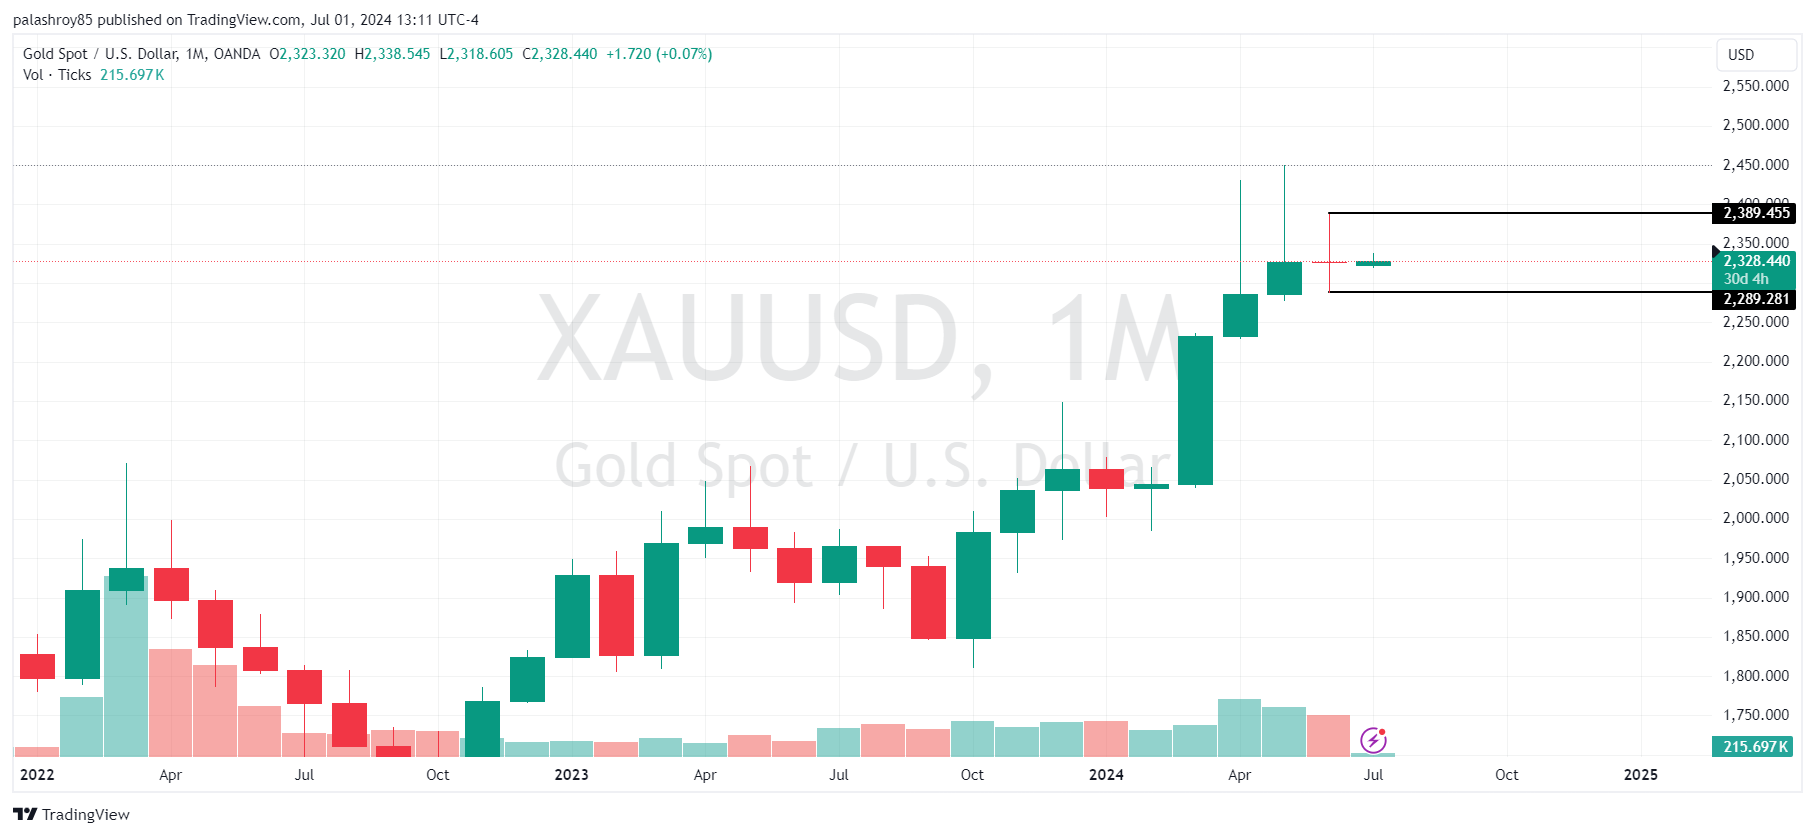
When analyzing gold on a monthly timeframe, the previous month's candle is an indecision or Doji candle. According to my strategy, I mark the high and low of the Doji candle. After a breakout above the high or below the low, the market usually finds a clear direction. If the price closes above the previous month's Doji candle’s high, we can expect a bullish trend.
Conversely, if the price closes below the Doji candle's low, a bearish trend is likely. This strategy is effective for swing trading or positional trading purposes as it is monthly time frame.

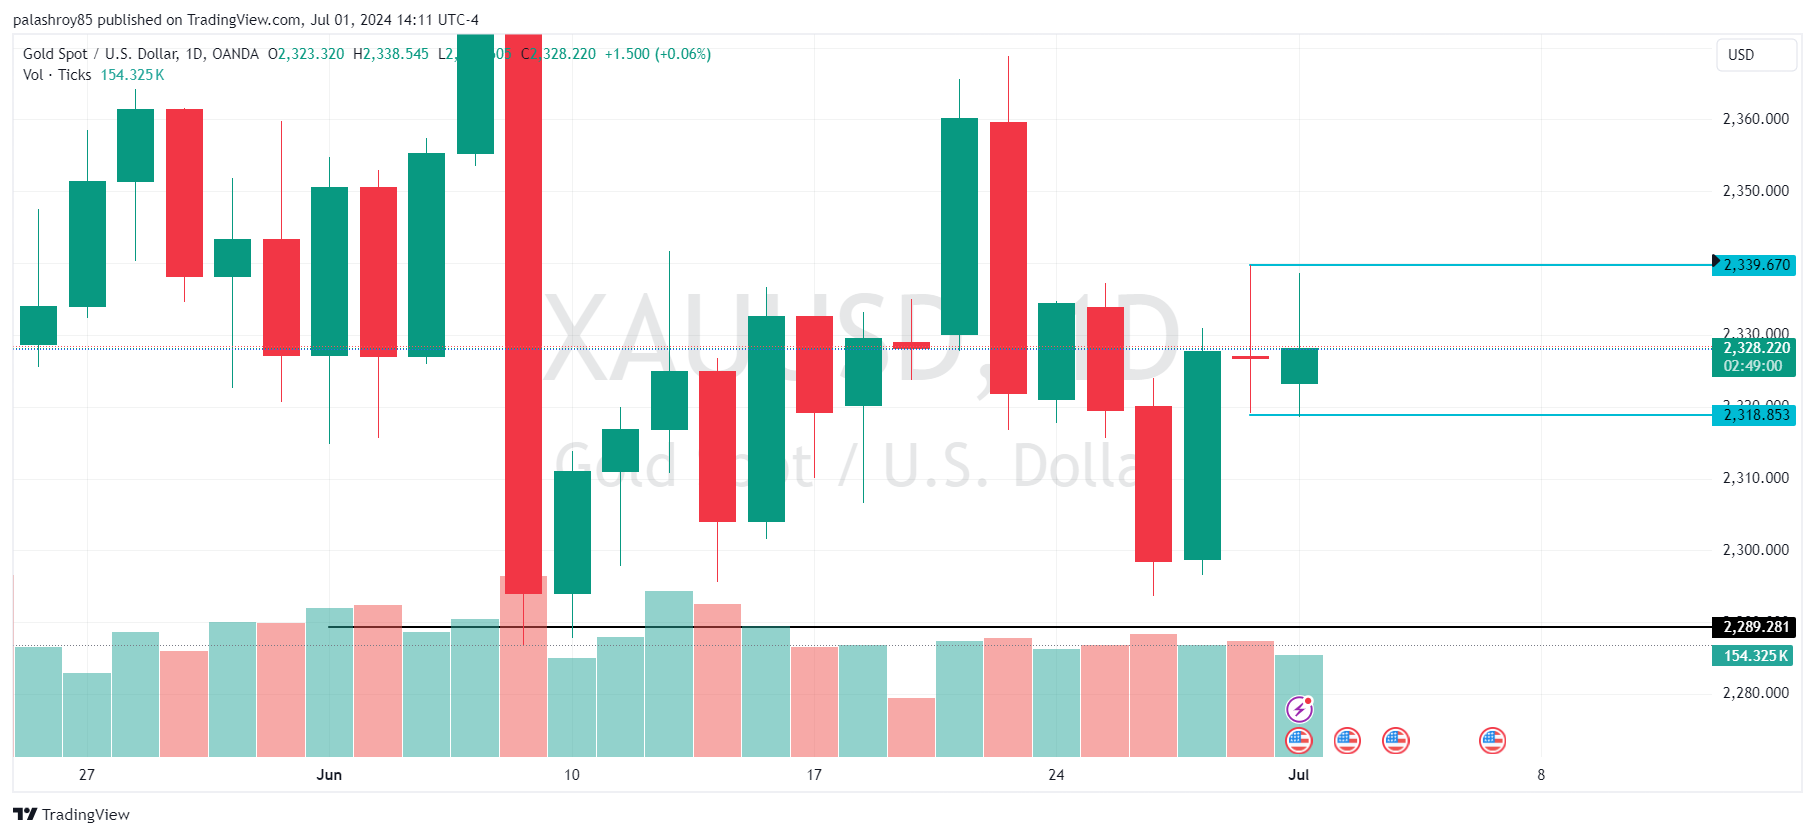
Analyzing gold on the daily timeframe, you'll notice that the last day's candle of the previous week also formed a Doji candle. Following our strategy, I've marked the low of that Doji candle at 2318.58 and the high at 2339.67. If the price breaks out of these levels on the daily timeframe, we can expect a bearish or bullish direction, respectively.
For the next few days, we need to monitor the daily candle closing. If the price closes below 2318.58 on the daily timeframe, our sell-side target will be 2289. On the other hand, if the price closes above 2339.67 on the daily timeframe, our buy-side target will be 2387.58.

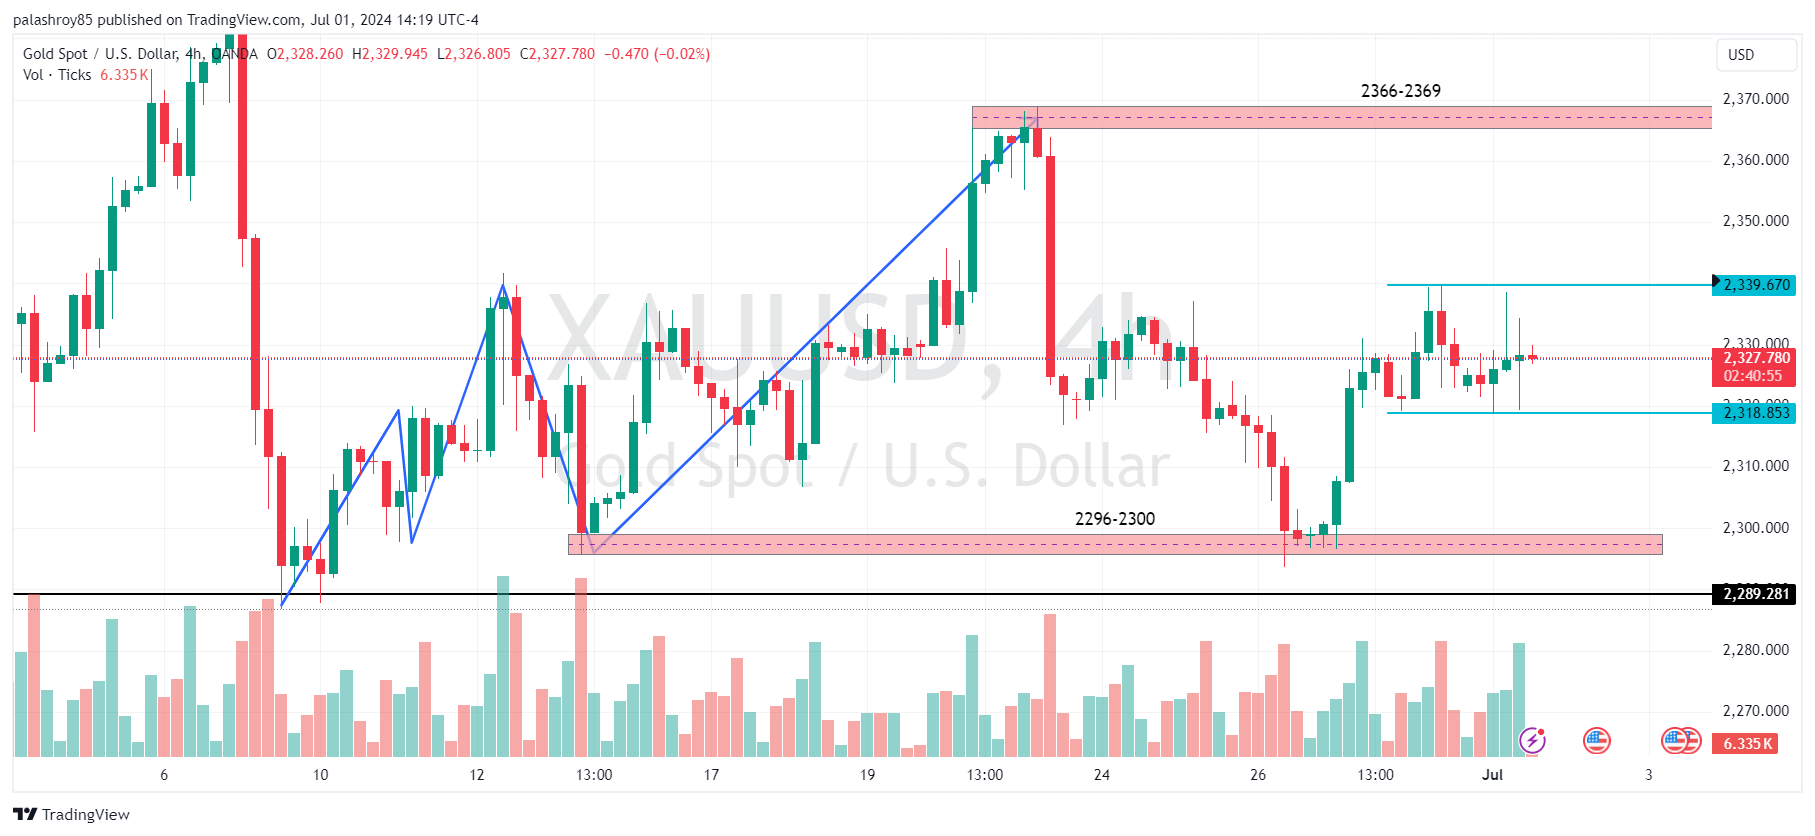
On the 4-hour timeframe, if we mark the internal structure of gold, it remains bullish. However, for the past two days, gold has been trading within a range. The upper range is 2339.70, which is also the high of the daily Doji candle, and the lower range is 2318.85, the low of the daily Doji candle.
Our trading plan is as follows:

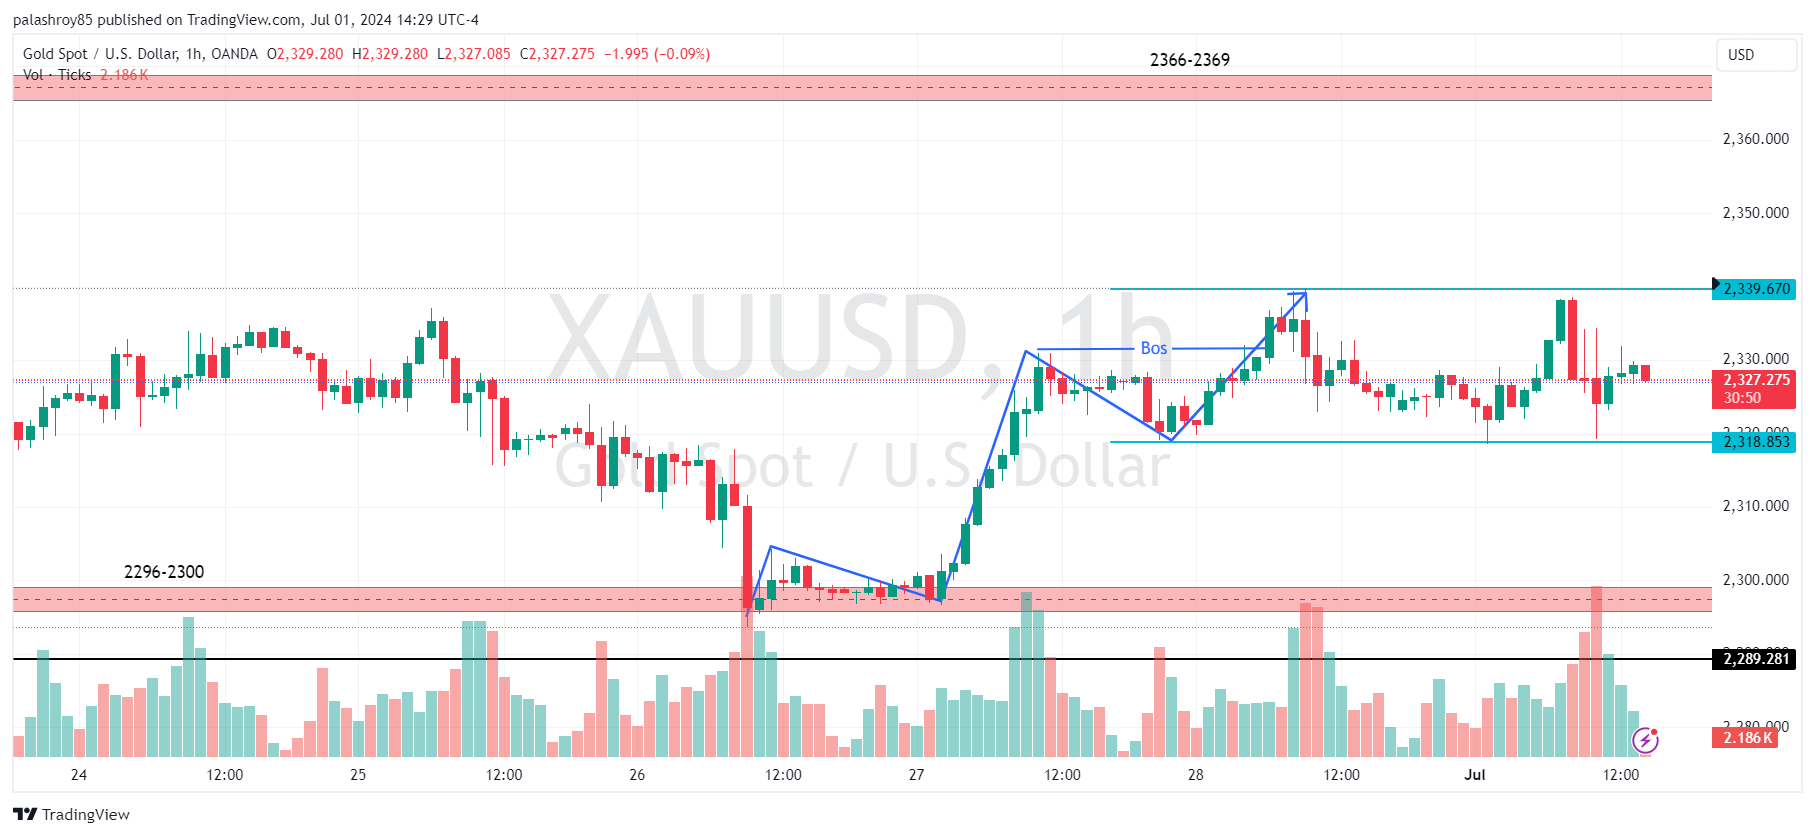
For scalping or intraday trading, let's look at potential trade setups on the 1-hour timeframe. On the 1-hour frame, the market clearly shows a range-bound structure.
According to our strategy for range-bound markets, we sell from the upper range and buy from the lower range. The upper range is 2338-2340. If the market slowly approaches this range, we can initiate a sell. However, keep in mind the high chance of a liquidity sweep, where the price may spike up and then return to the range.
Similarly, we can buy from the lower range of 2318-2320 if the market slowly approaches this range. Again, be cautious of the risk of a liquidity grab.

This analysis provides a comprehensive outlook on XAUUSD, combining technical insights with upcoming economic data. It's essential to perform your own analysis and practice on a demo account before engaging in live trading. The market can be unpredictable, and proper preparation is crucial for success.
Stay updated with our latest analyses and insights into the Forex market. If you have any questions or suggestions, feel free to contact us or leave a comment below.
Comments