THE FOREX TRENDS
Revealing the World of Forex: Expert Analysis and Secrets of successful trading
In this article, we will discuss Weekly analysis of Gold (XAUUSD) from 24 Jun 2024 to 28 Jun 2024.
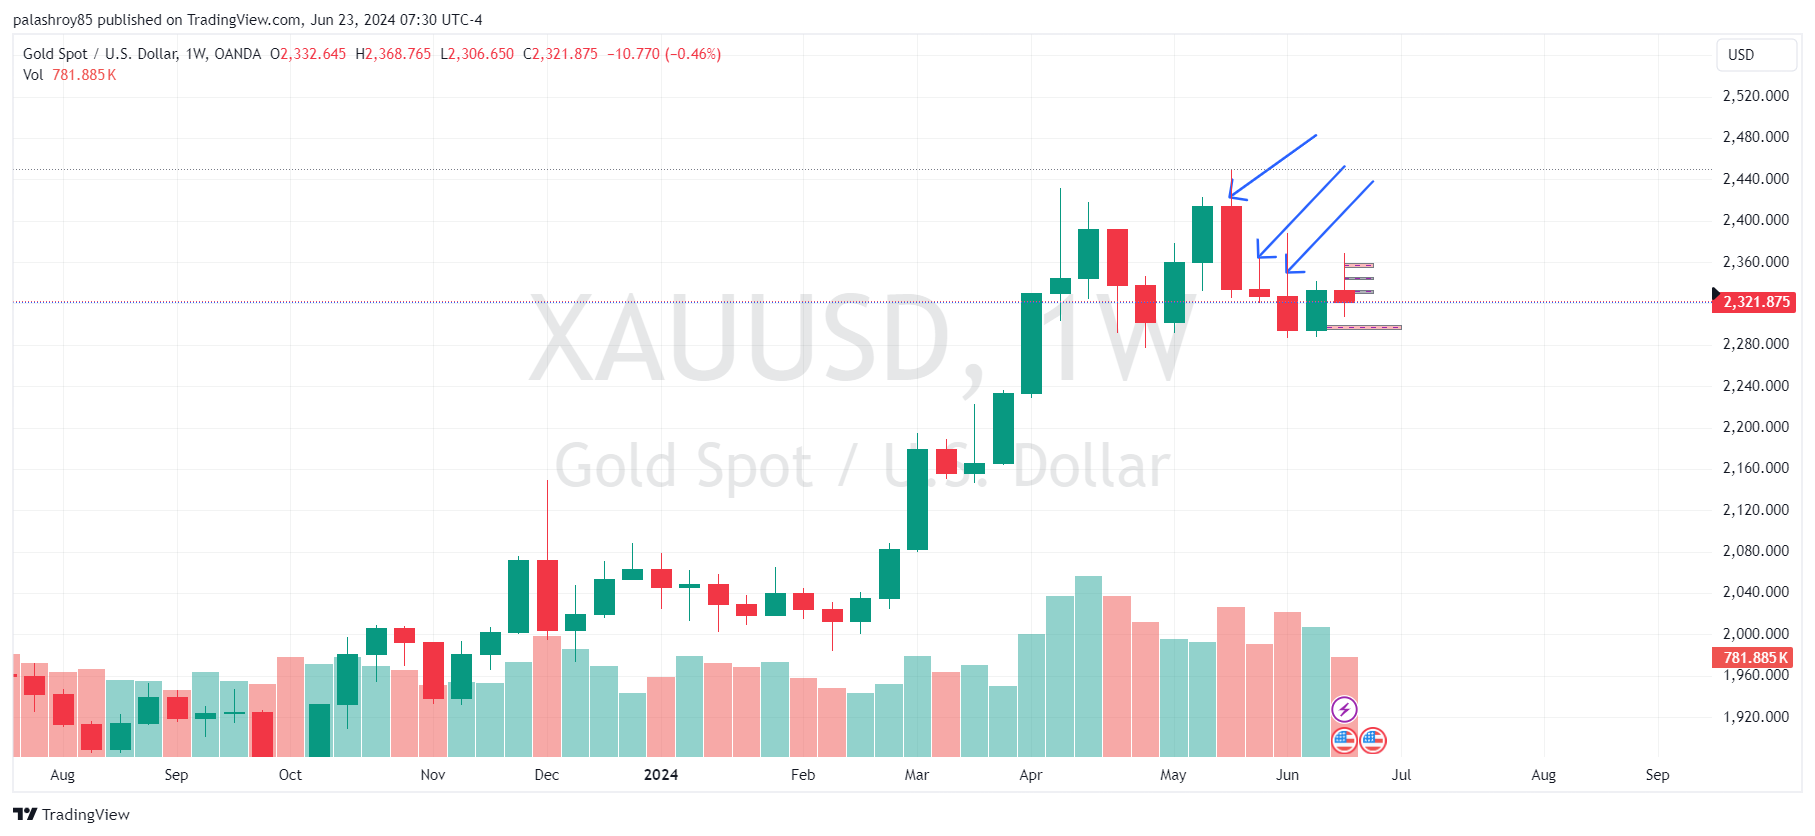
In the weekly chart of gold, we are still bullish, but if we look at the last five weeks' candles, we can see selling pressure. There are three consecutive bearish candles before the previous two weeks. All three candles have long spikes from the top, indicating significant selling pressure. So, we might see some more selling in the upcoming week.
Next week, the US GDP data is also going to be released. As we know, the US economy is still in expansion mode, so there is a possibility that the GDP data will come out greater than the previous and forecasted values. If this happens, we might see good selling in gold. However, if the GDP data is negative, we will see short-term bullishness in gold, followed by a ranging market.

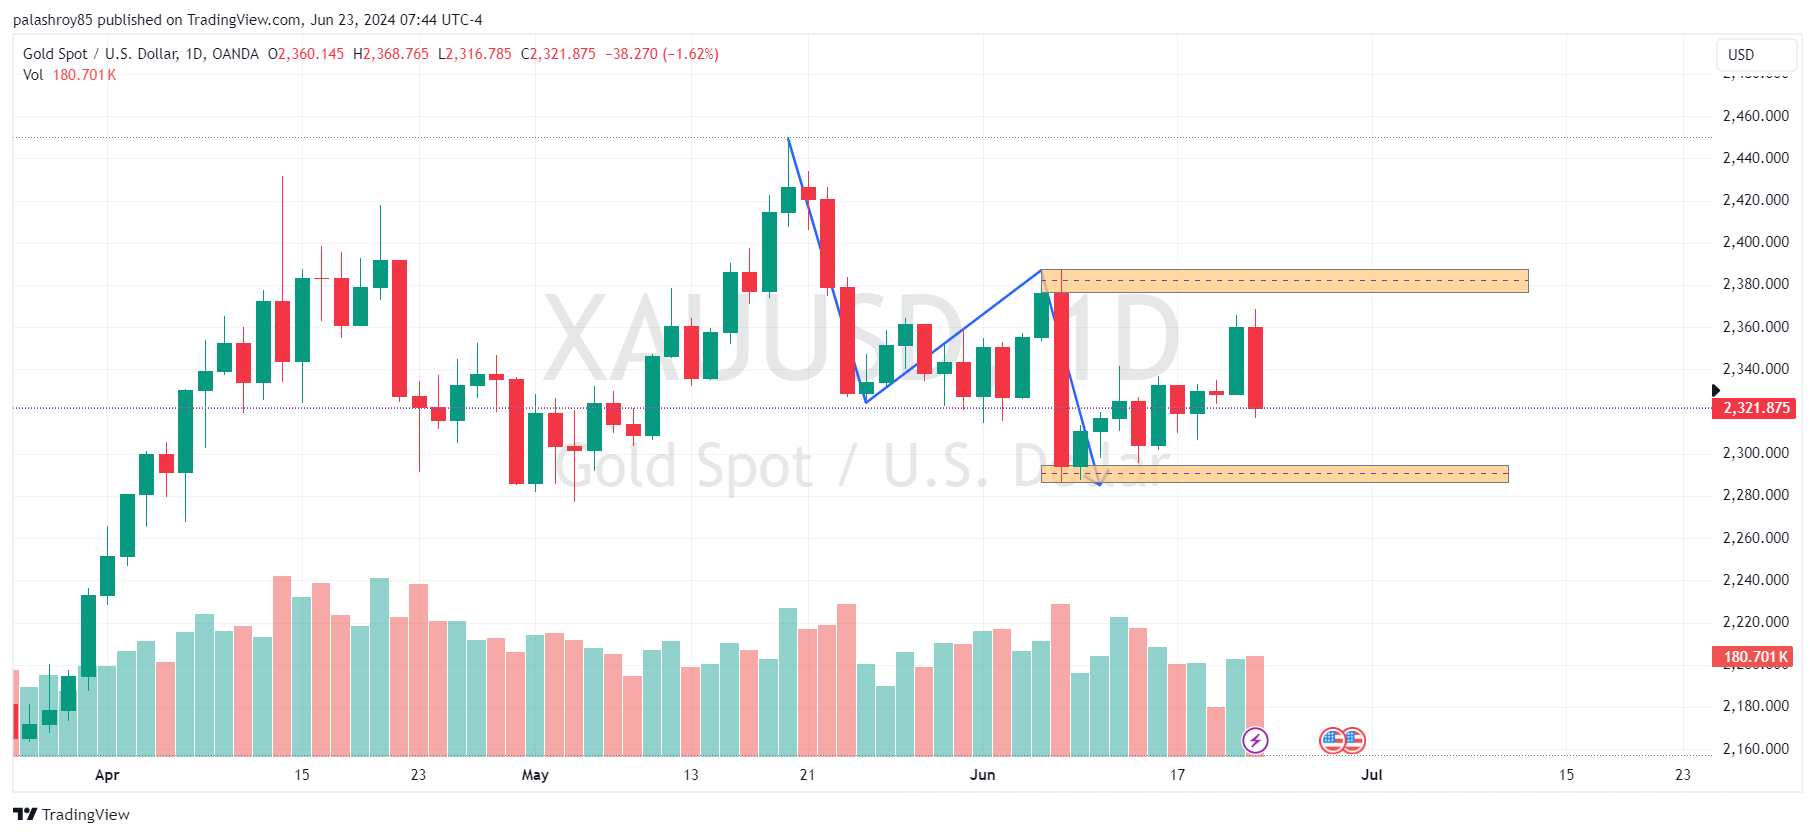
In the daily frame of gold, if I mark the structure, we can see lower lows and lower highs being created. According to the daily structure, there is a strong resistance zone at 2377 to 2387. As long as the price stays below this zone, we remain bearish on gold. If the price can break this zone, we will turn bullish on gold for the long term. If the price reaches this zone, we can sell from there for long term with proper SL.
In the daily frame, according to the market structure, 2286-2294 is a strong support zone. Additionally, 2286 is a strong support in the monthly, weekly, and daily frames. So, if the price reaches the 2286 zone, we can buy for small profits. The reason for targeting small profits is because the market sentiment is currently bearish.

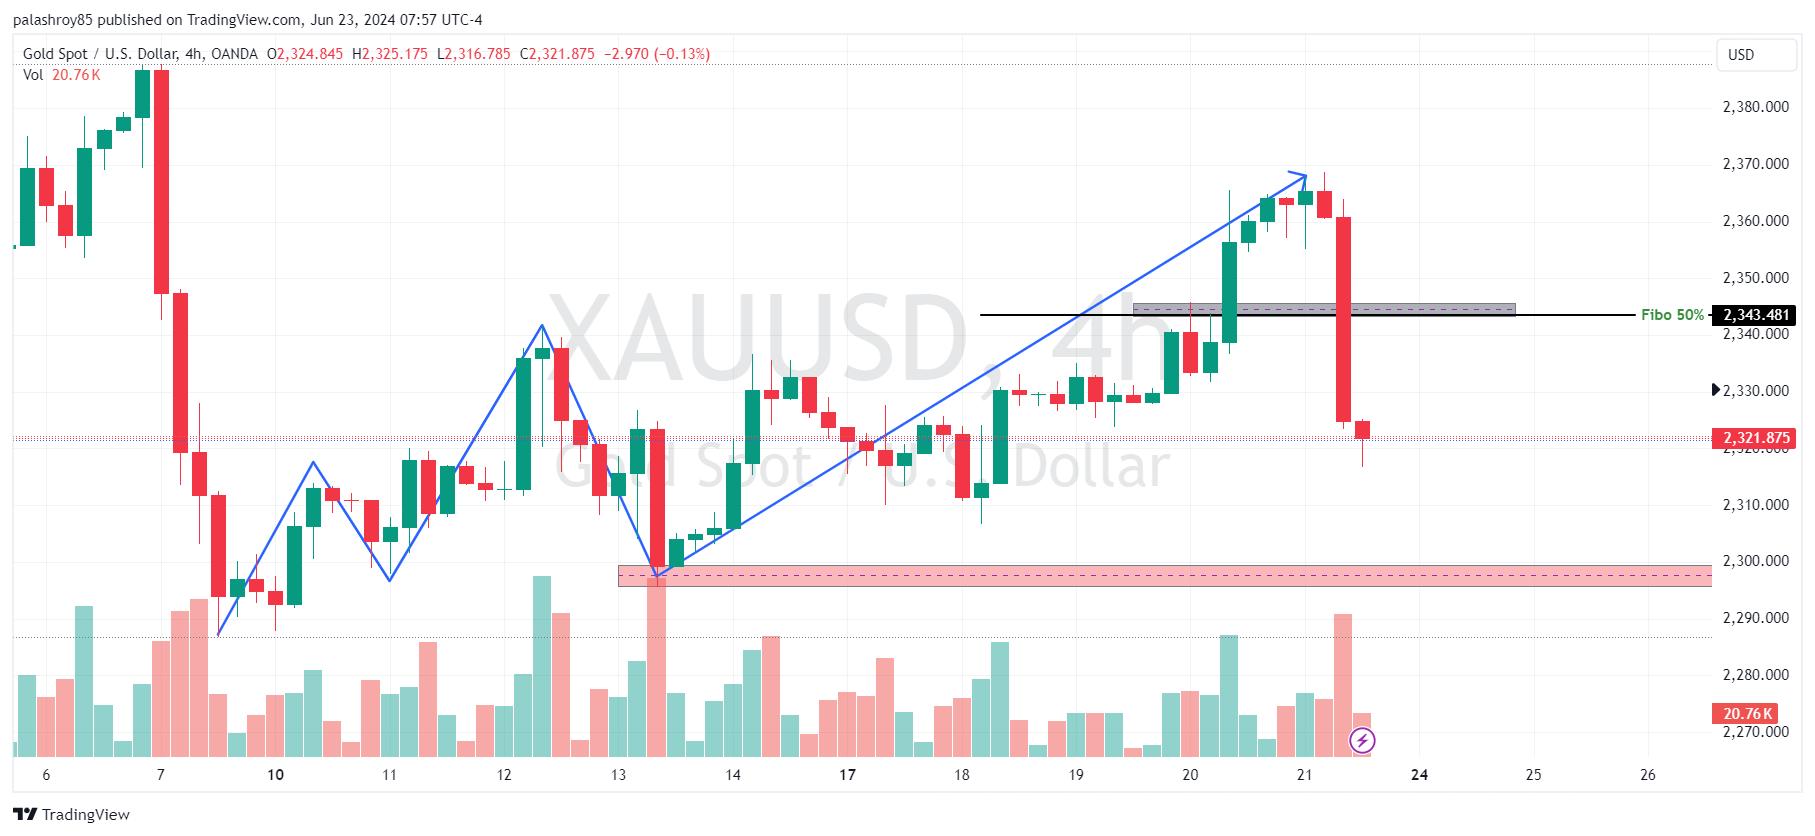
In the 4-hour frame of gold, if I mark the structure, it is still clearly bullish. In the 4-hour frame, 2296-2300 is the last and strong support. Until the market breaks this support, we cannot sell gold for swing trade purposes. If in intraday we get the price in the 2296-2300 zone and get some evidence, we can initiate a buy for small profit.
In the 4-hour frame, if we plot Fibonacci retracement for the last swing, we get a 50% retracement at 2343.50, and 2343-2346 is also a structural zone in the 1-hour frame. So, if we get the price in this zone this week, we can look for selling opportunities after getting some evidence for intraday purpose.

I hope this article is helpful for you to understand Weekly analysis of Gold (XAUUSD) from 24 Jun 2024 to 28 Jun 2024.
Stay tuned to our website for more tutorials about Forex Market. If you have any suggestions or queries, feel free to Contact us or drop your message in the comment section below.
Comments