THE FOREX TRENDS
Revealing the World of Forex: Expert Analysis and Secrets of successful trading
Last week, we saw the release of the NFP data and a speech by Fed Chair Powell. Although the NFP data exceeded expectations, it was significantly lower than the previous figure. There is no doubt that the US labor market is gradually cooling down. Fed Chair Powell will give testimony to the Senate Banking Committee on Tuesday. In my opinion, we might hear again that inflation is gradually decreasing but still far from the target rate of 2%.
Last week, Powell also mentioned that if there is a sudden weakness in the labor market, he would react promptly. Considering last week's macroeconomic news, I believe they will not cut their interest rate before September. However, if they find strong evidence that inflation has stabilized before September, they may loosen their restrictive policy.
On the other hand, the US economy remains strong, and consumer confidence is high, which indicates persistent inflation. If money flow in the market remains high, meaning consumer confidence is high, the chances of reducing inflation decrease. In such a scenario, the Fed might delay the rate cut from September to December.
We will carefully focus on this week's data, which will give us indications of what to expect in the future.
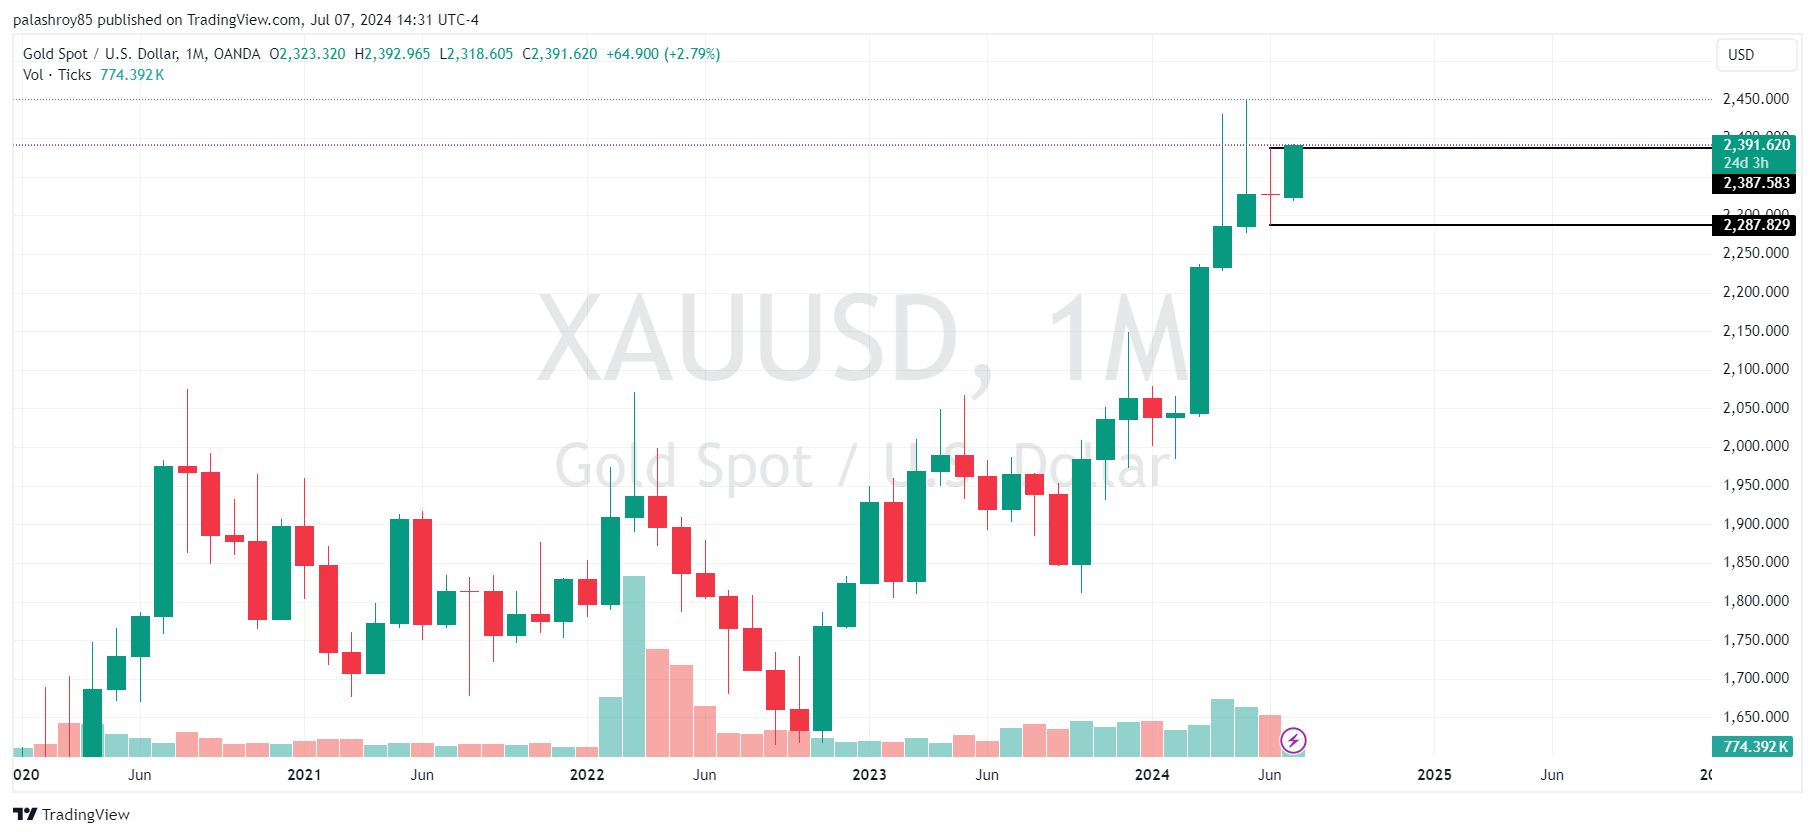
When we analyze gold on the monthly chart, it shows weakness over the past three months, with strong resistance at the 2440-2450 level. The previous month's candle is an indecision or Doji candle. According to my strategy, I mark the high and low of the Doji candle. After a breakout above the high or below the low, the market usually finds a clear direction.
If the price closes above the previous month's Doji candle’s high of 2387.5 and sustained at the end of the month, we can expect a bullish trend again. Conversely, if the price closes below the Doji candle's low of 2287.82, a bearish trend is likely. This strategy is effective for swing trading or positional trading purposes as it is based on the monthly timeframe.

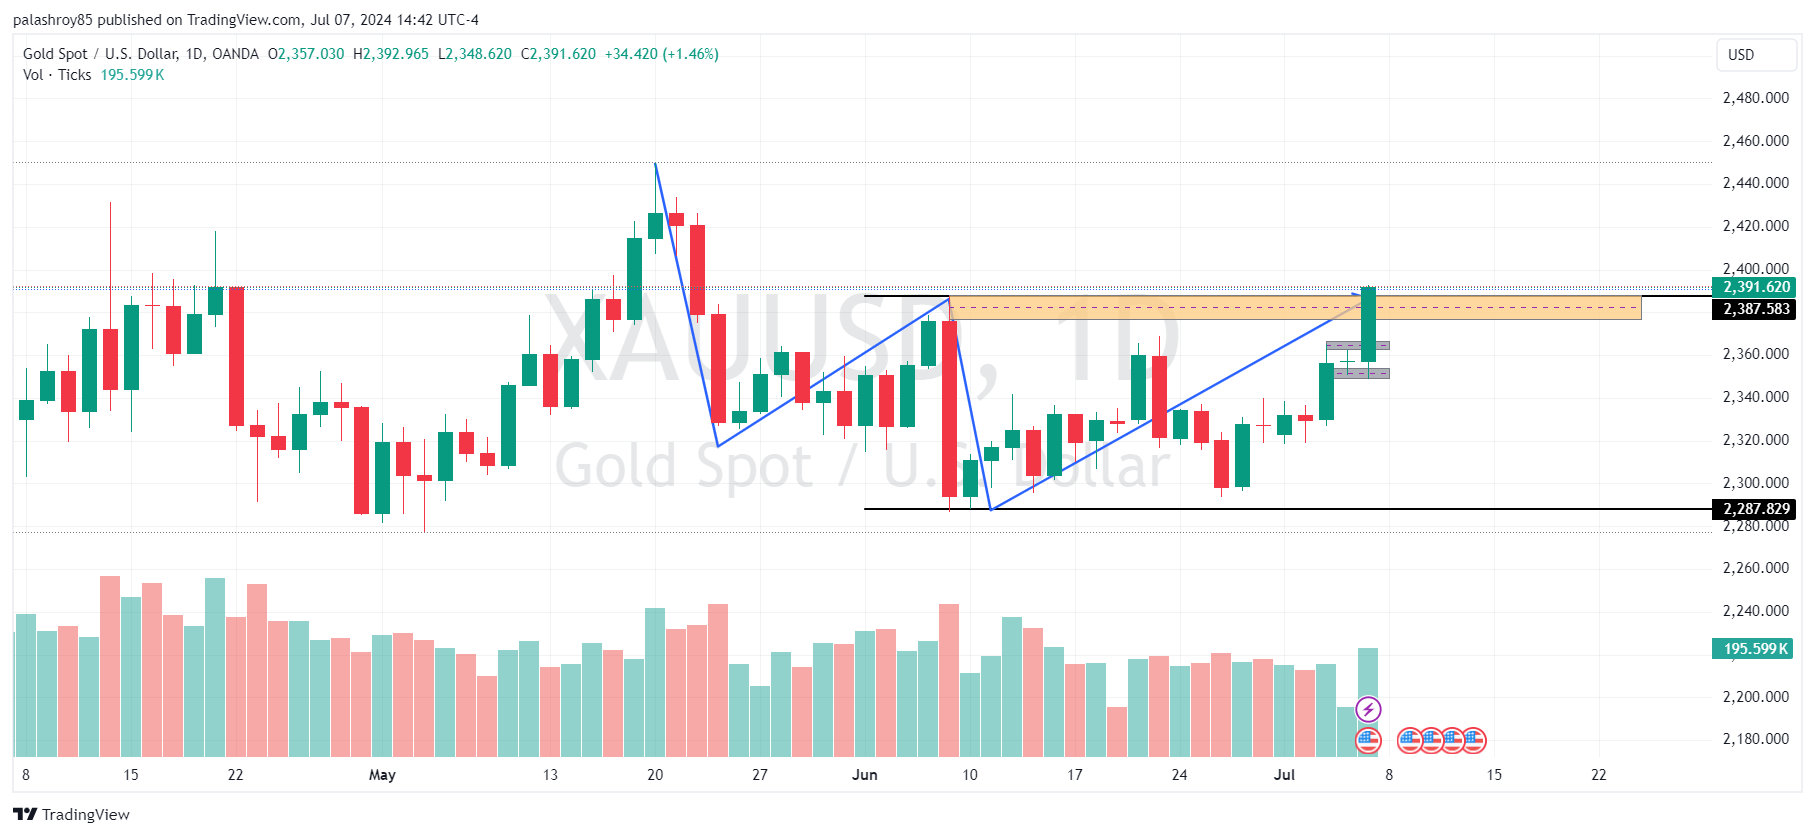
If we mark the structure on the daily frame, you will see a bearish structure as the price is creating lower lows and lower highs. According to the daily frame structure, our last lower high and resistance is at 2387. If the market closes two consecutive candles above this price on the daily frame, we will turn bullish for the long term.
On the other hand, if the market rejects this resistance and moves down with high volume, we can expect a good selling opportunity. We need to carefully observe Monday's candle closing.

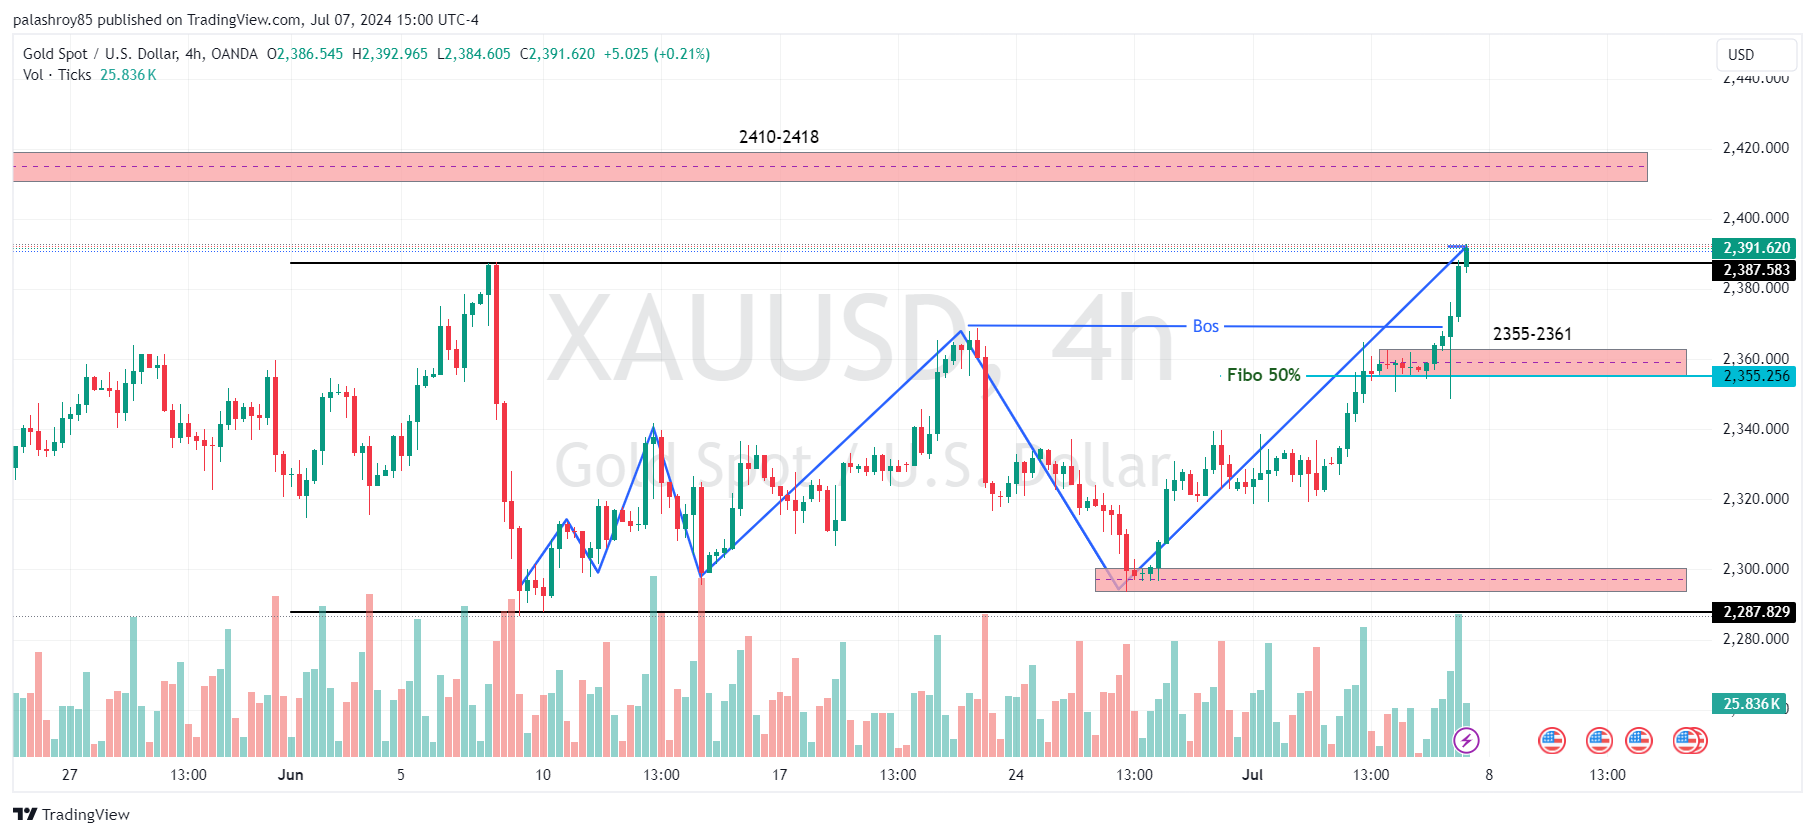
Analyzing gold on the 4-hour frame, we see that the market structure is strongly bullish. In such a strong bullish trend, we should avoid selling, especially for swing trade purposes. According to the market structure, a Break of Structure (BOS) is evident. When a BOS forms in the market, we typically have two points of interest (POI) to join the current trend.
Our first POI is at the 2355-2361 level for initiating a buy trade. This POI also aligns with the 50% Fibonacci retracement area, making it a strong support zone. We may consider initiating a buy from this zone this week.
Our second POI is at the 2295-2300 level. As long as the market trades above this zone, we remain bullish on XAUUSD. If the price is able to break this last support in the 4-hour frame, we will turn into sellers. If the price reaches this second POI, we can also consider initiating a buy, but it is currently quite far from the current price.
For selling opportunities in gold, there is an unmitigated order block at the 2410-2418 level. This order block has not been tested yet. There is a high chance that the market could test this order block and retrace up to 200 pips. If we get a strong rejection from this zone on a smaller timeframe, we may initiate a sell from there.

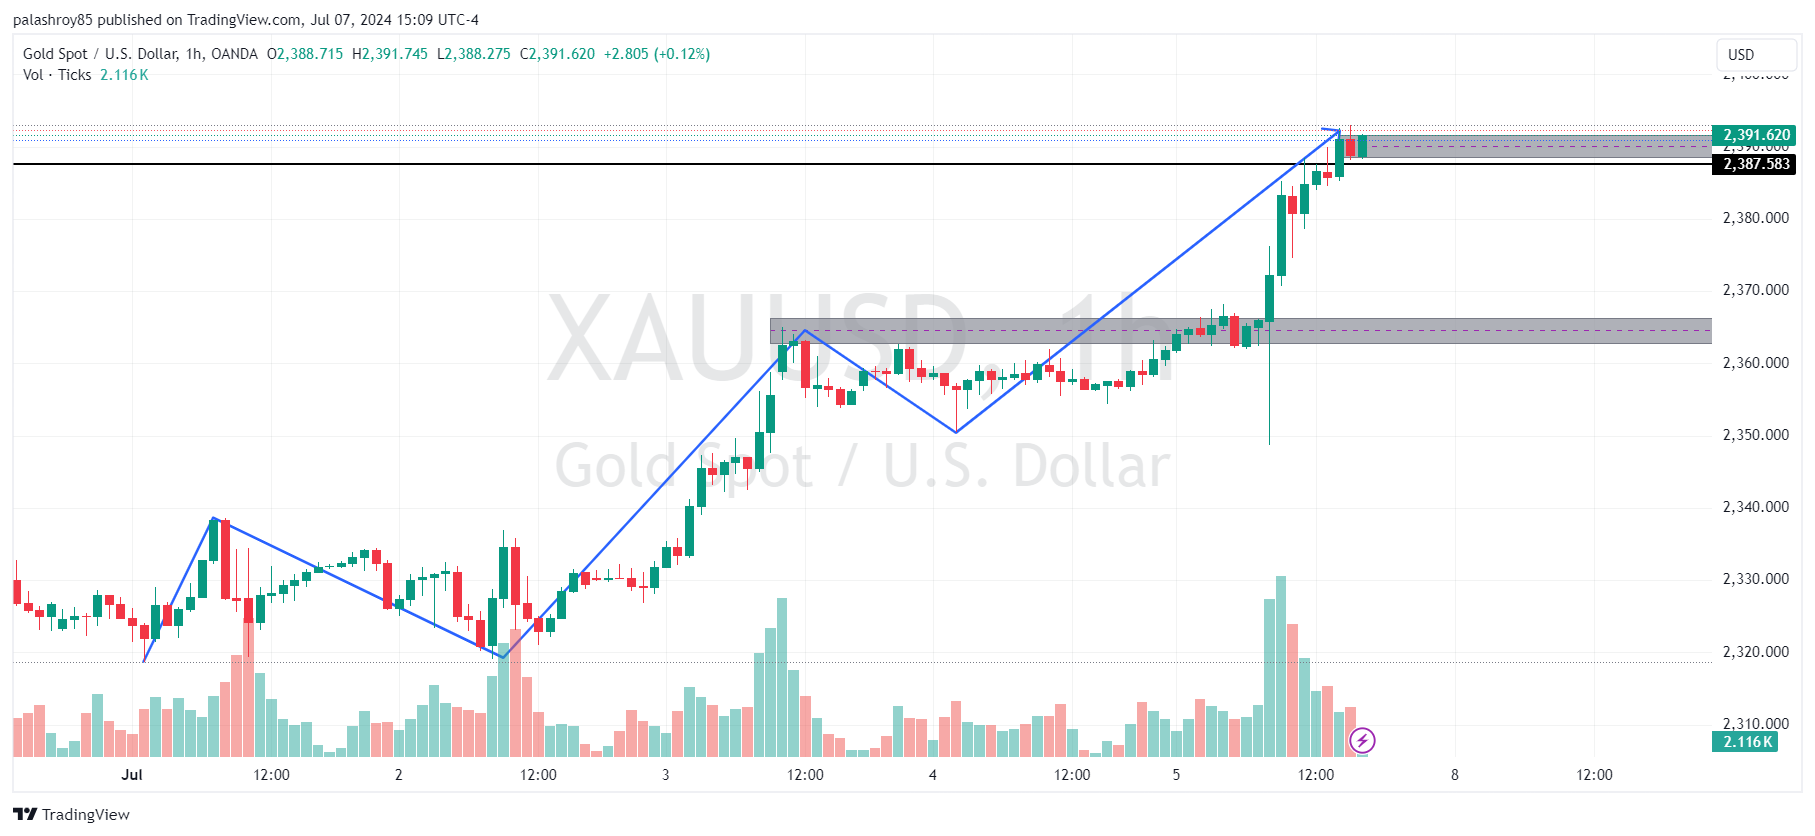
Analyzing gold on the 1-hour frame, it is clearly bullish. According to the 1-hour frame, the 2363-2366 zone is a good area to consider buying after getting confirmation. However, the market opening on Monday is critical. If the market opens and retraces, meaning the price moves down, we can consider selling at the 2388-2391 level retest for scalping or intraday purposes.
Keep in mind that 2355 is an optimal price to initiate a buy in XAUUSD.

This analysis provides a comprehensive outlook on XAUUSD, combining technical insights with upcoming economic data. It's essential to perform your own analysis and practice on a demo account before engaging in live trading. The market can be unpredictable, and proper preparation is crucial for success.
Stay updated with our latest analyses and insights into the Forex market. If you have any questions or suggestions, feel free to contact us or leave a comment below.
Comments