THE FOREX TRENDS
Revealing the World of Forex: Expert Analysis and Secrets of successful trading
The USD/JPY pair experienced a sharp decline on Thursday, plummeting 2.6% due to cooling US Consumer Price Index (CPI) inflation and speculated intervention by the Bank of Japan (BoJ) to stabilize the struggling yen.
June’s CPI inflation numbers fell below expectations, with the annualized headline CPI dropping to 3.0% year-over-year (YoY) from the previous 3.3%, and below the forecasted 3.1%. Month-over-month (MoM) CPI inflation decreased by -0.1% in June, falling from the previous flat 0.0% and missing the forecasted 0.1%.
US Initial Jobless Claims decreased to 222,000 for the week ending July 5, down from the revised 239,000 the previous week, and better than the forecasted 236,000. This led to a reduction in the four-week average to 233,500 from 238,750.
With US CPI inflation cooling rapidly, market expectations for Federal Reserve rate cuts in 2024 have intensified. The CME’s FedWatch Tool indicates a 95% probability of a rate cut in September.
Unconfirmed reports suggested a coordinated "Yentervention" by Japanese officials timed with the US CPI data release, causing a broad rally in the yen. Official confirmation or denial from the BoJ or Ministry of Finance is not expected for several weeks.
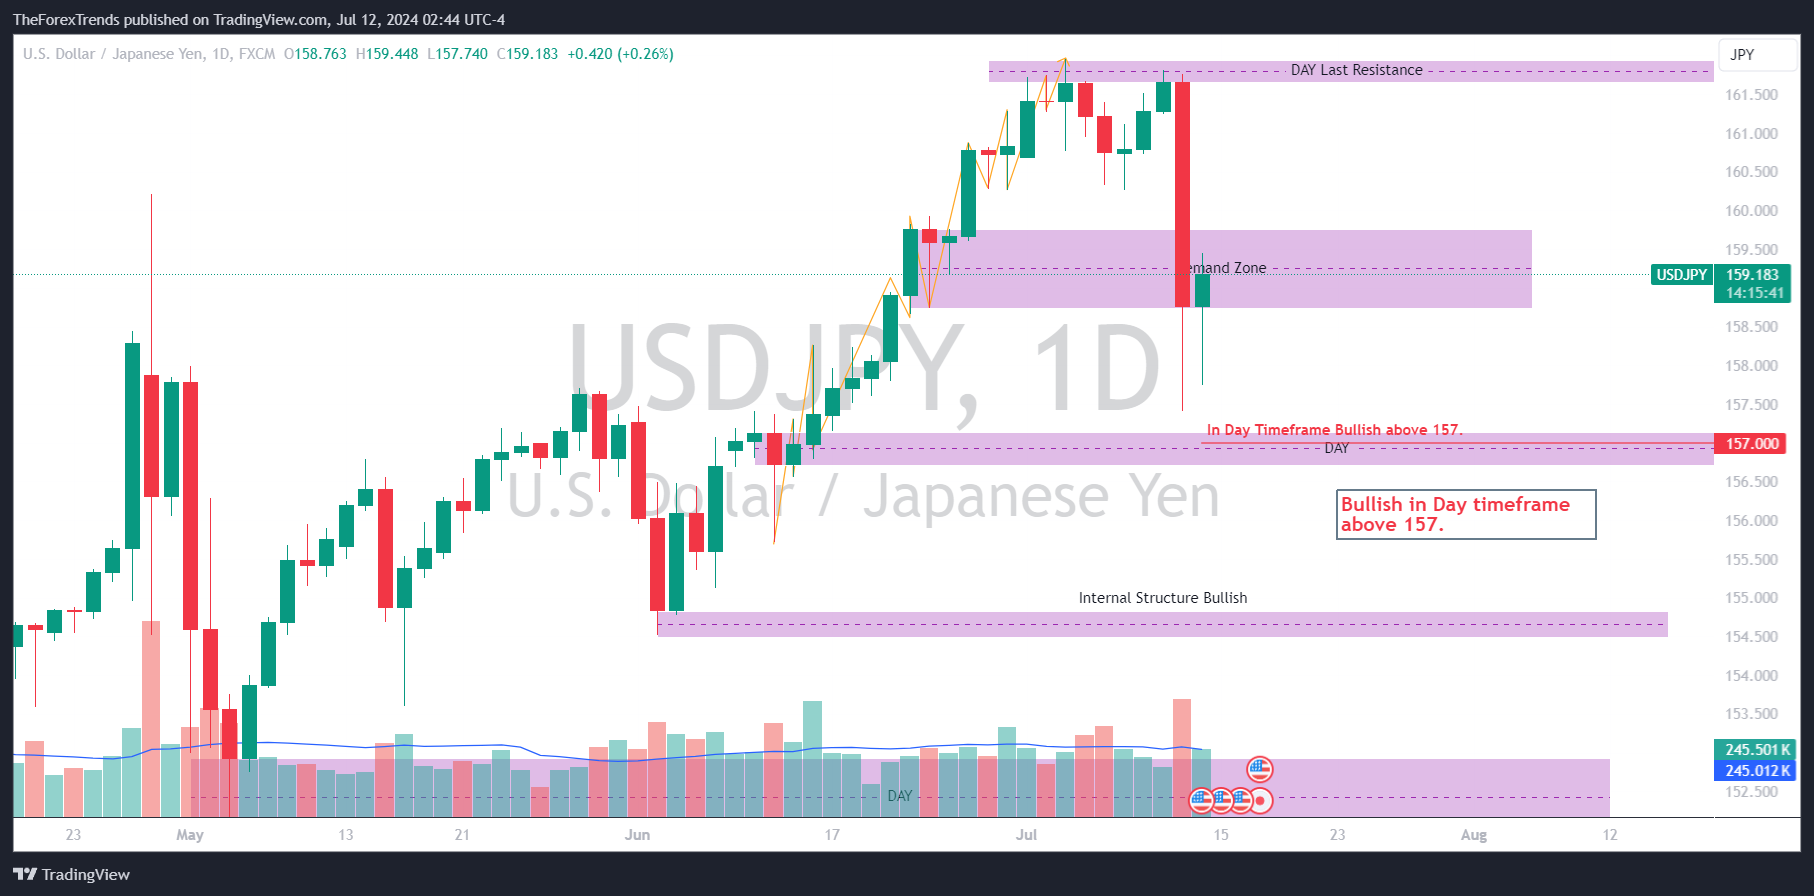
USD/JPY maintains an upward channel pattern, suggesting a bullish trend. However, the pair fell sharply from the double top level due to the cooling US CPI inflation. Immediate support is at 157.0, with the next support level at 154.66.

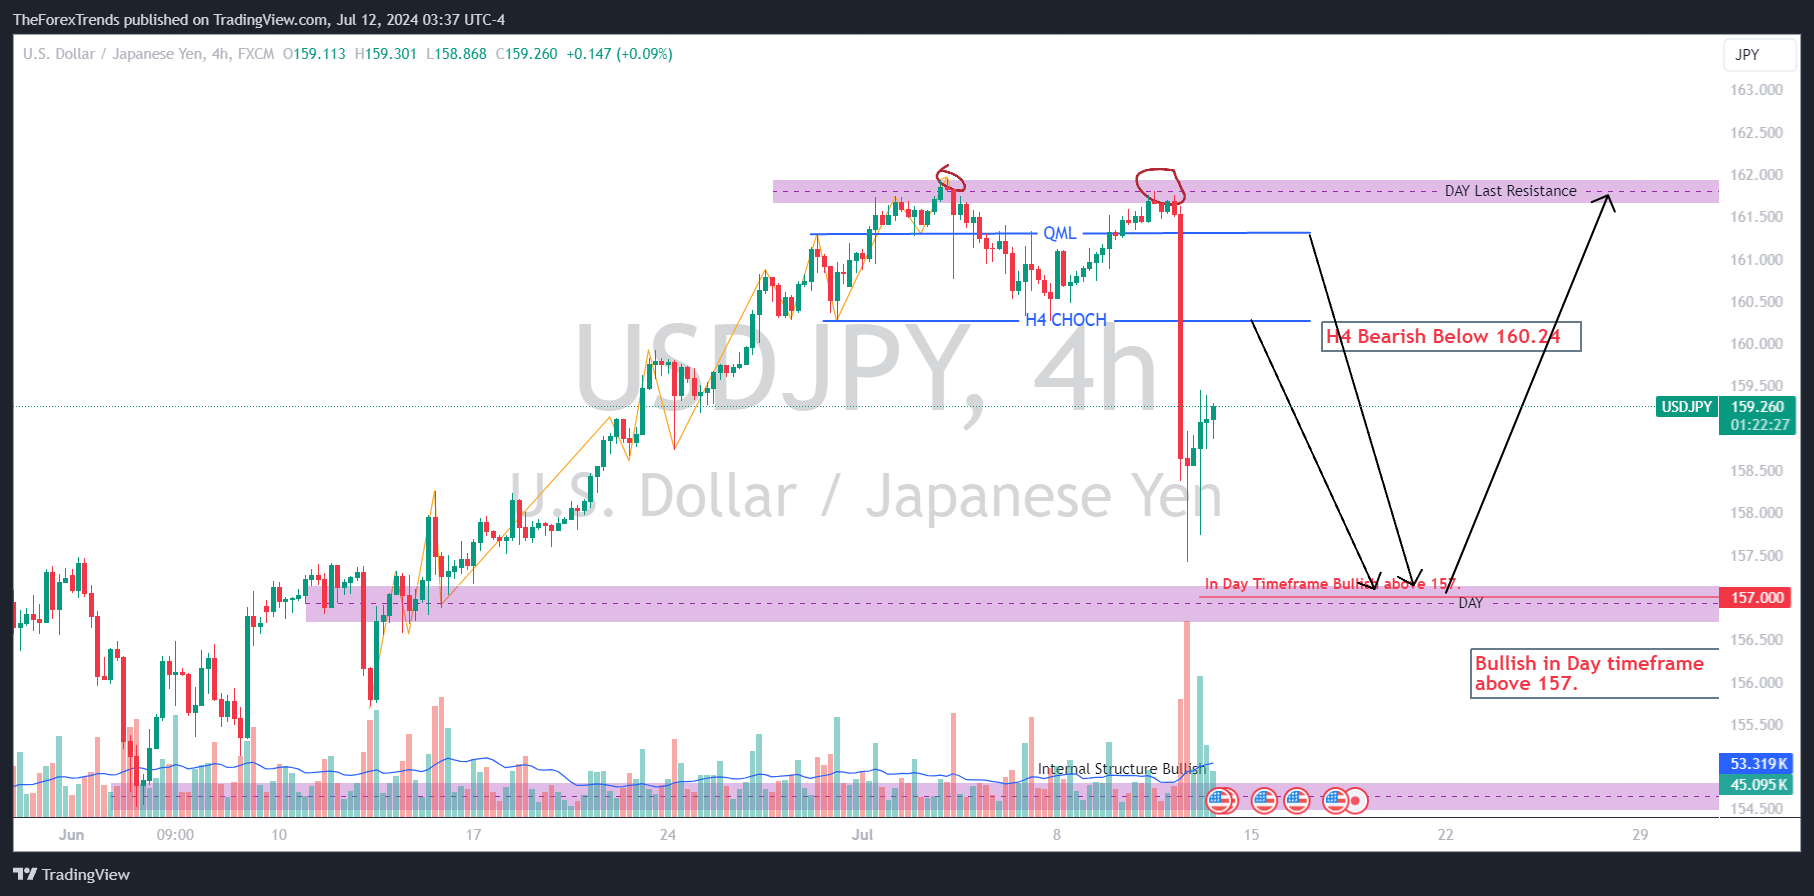
On the H4 chart, USD/JPY was initially bullish on Thursday but reversed course, declining 2.6% after the US CPI data release and suspected BoJ intervention. Technically, the price reacted to the H4 QML level, turning bearish with significant momentum. The pair is now bearish below 160.25.

This analysis provides a comprehensive outlook on USDJPY, combining technical insights with the available economic data in public domain. It's essential to perform your own analysis and practice on a demo account before engaging in live trading. By monitoring these key levels, traders can better navigate the USD/JPY market dynamics.
The market can be unpredictable, and proper preparation is crucial for success.
Stay updated with our latest analyses and insights into the Forex market. If you have any questions or suggestions, feel free to contact us or leave a comment below.
Comments