THE FOREX TRENDS
Revealing the World of Forex: Expert Analysis and Secrets of successful trading
Biden’s withdrawal from the upcoming U.S. presidential election has sent shockwaves through the market. Most asset classes are holding steady as investors digest this event. The dollar remains poised at its high from last Friday, with expectations of strengthening as Trump’s advocacy may favor the greenback.
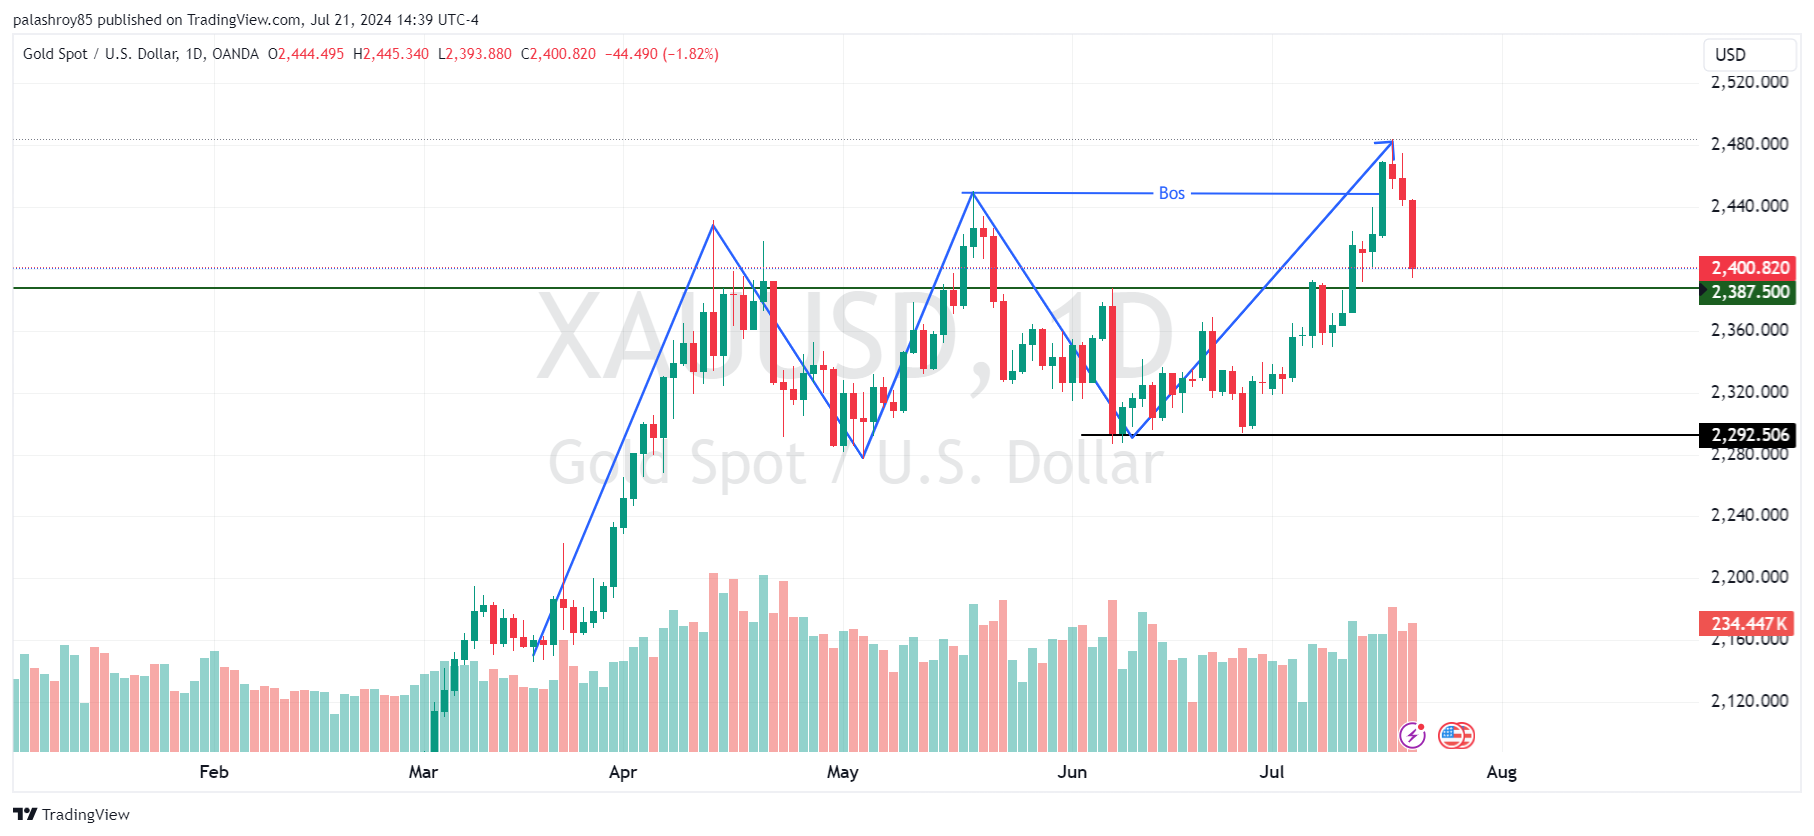
Following the overall market sentiment, gold traded below $2,400 yesterday. Last week, gold experienced profit-booking after rallying to all-time highs above $2,480.
Another important factor to note is that gold has been in a bullish momentum for a couple of months due to growing expectations of a rate cut. This sentiment has already been priced into the gold market.
This week, several important news events are scheduled that will impact the US Dollar. Two key releases stand out:
It's crucial to closely monitor both of these data releases for their potential impact on market sentiment.
Higher Time Frame Analysis and Key Levels in Gold
The closing of this month's candle is crucial for us. As discussed in my previous analysis, the 2387.50 level is a key price because it represents last month's doji candle high. If this month's candle closes below this price, we could see a significant correction in gold. On the other hand, if the monthly candle closes above this key price, we could see a further bullish impulsive move above 2500.
Looking at the weekly chart, last week's candle is a no demand candle, indicating potential selling in the coming weeks. Additionally, last week's candle closed below the previous week's candle closing, suggesting selling opportunities from solid levels this week.
It's important to note that gold remains bullish when analyzing the daily frame market structure. It has formed a bullish break of structure (BOS) (refer below image). According to advanced market structure rules, when the market forms a BOS, we have two points of interest (POI) to join the current trend. Our first POI, which was in the 2430-2447 range, has been clearly broken. Now, the price may approach our second POI, which is around the 2300 level. Until the price breaks this level, we will remain bullish on gold.

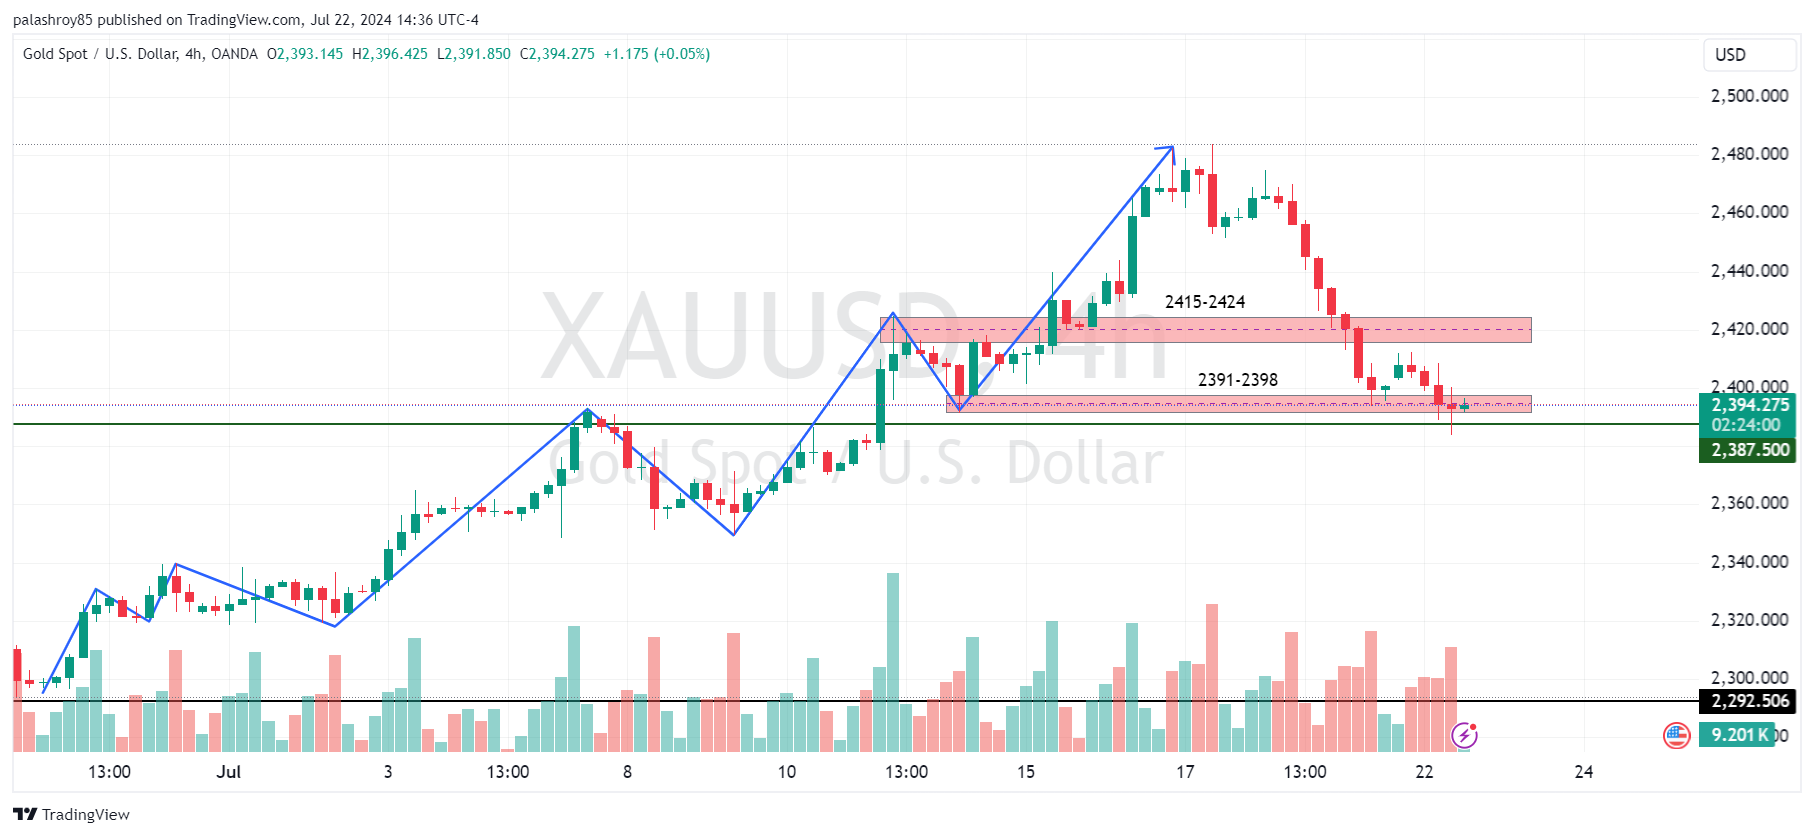
Yesterday, gold was unable to break the last support on the 4-hour frame, which is in the 2391-2398 range (refer below image). As discussed in my previous analysis, this is a very strong static support zone according to advanced market structure principles.
Yesterday, the price attempted multiple times to break this support but failed. This is because buyers became active below this price, taking control from sellers. Additionally, there has been a liquidity sweep below this support zone on yesterday.
So until the market breaks this support with momentum candles or long-bodied bearish candles, we should not sell gold in this zone. If the price manages to break this support zone, we can consider selling on the retest. Conversely, if we see strong evidence of bullishness at this zone, we may initiate a buy from here.

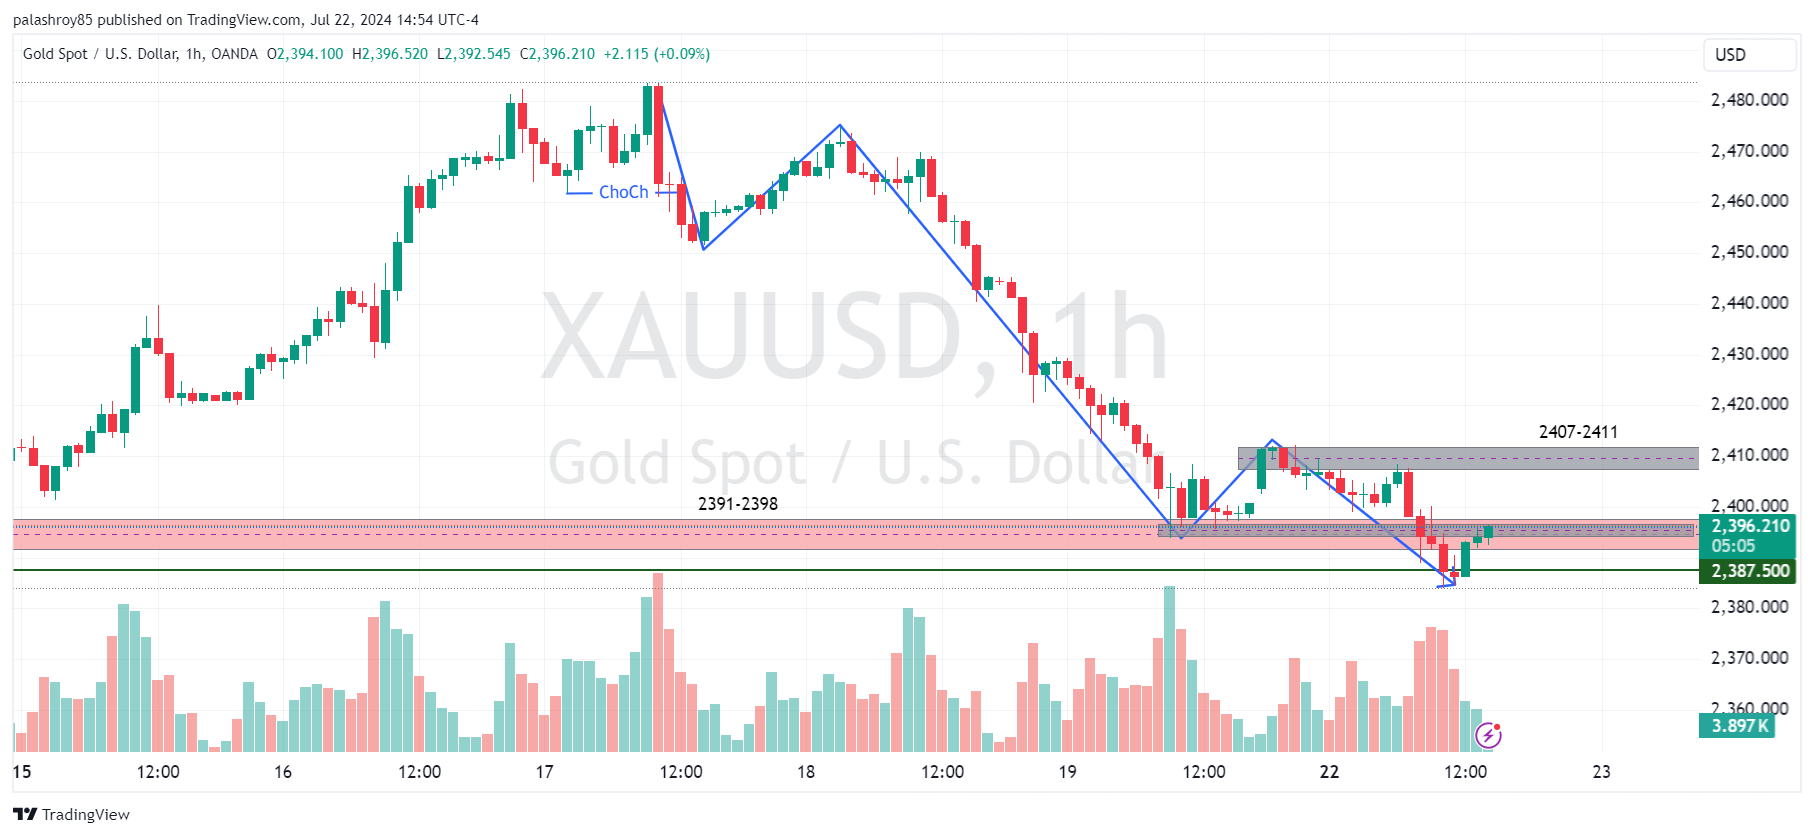
Let's look at the 1-hour frame to identify intraday trading opportunities in the gold market for today.
In the 1-hour frame, gold has formed a change of character (ChoCh), indicating a shift from bullish to bearish bias according to the rules of advanced market structure. Additionally, gold has created five bearish waves against the previous bullish trend. This clearly indicates selling pressure in gold.
As per the advanced market structure, after the last Break of Structure (BOS) was created (as shown in the image below), we have two POIs to initiate a selling trade in gold for intraday or scalping:

This analysis provides a comprehensive outlook on XAUUSD, combining technical insights with upcoming economic data. It's essential to perform your own analysis and practice on a demo account before engaging in live trading. The market can be unpredictable, and proper preparation is crucial for success.
Stay updated with our latest analyses and insights into the Forex market. If you have any questions or suggestions, feel free to contact us or leave a comment below.
Comments