THE FOREX TRENDS
Revealing the World of Forex: Expert Analysis and Secrets of successful trading
Today at 7:30 PM IST, the USA's CB Consumer Confidence data will be released. The forecast suggests an increase compared to the previous data. Given the strong state of the US economy, positive data could trigger a sell-off in gold.
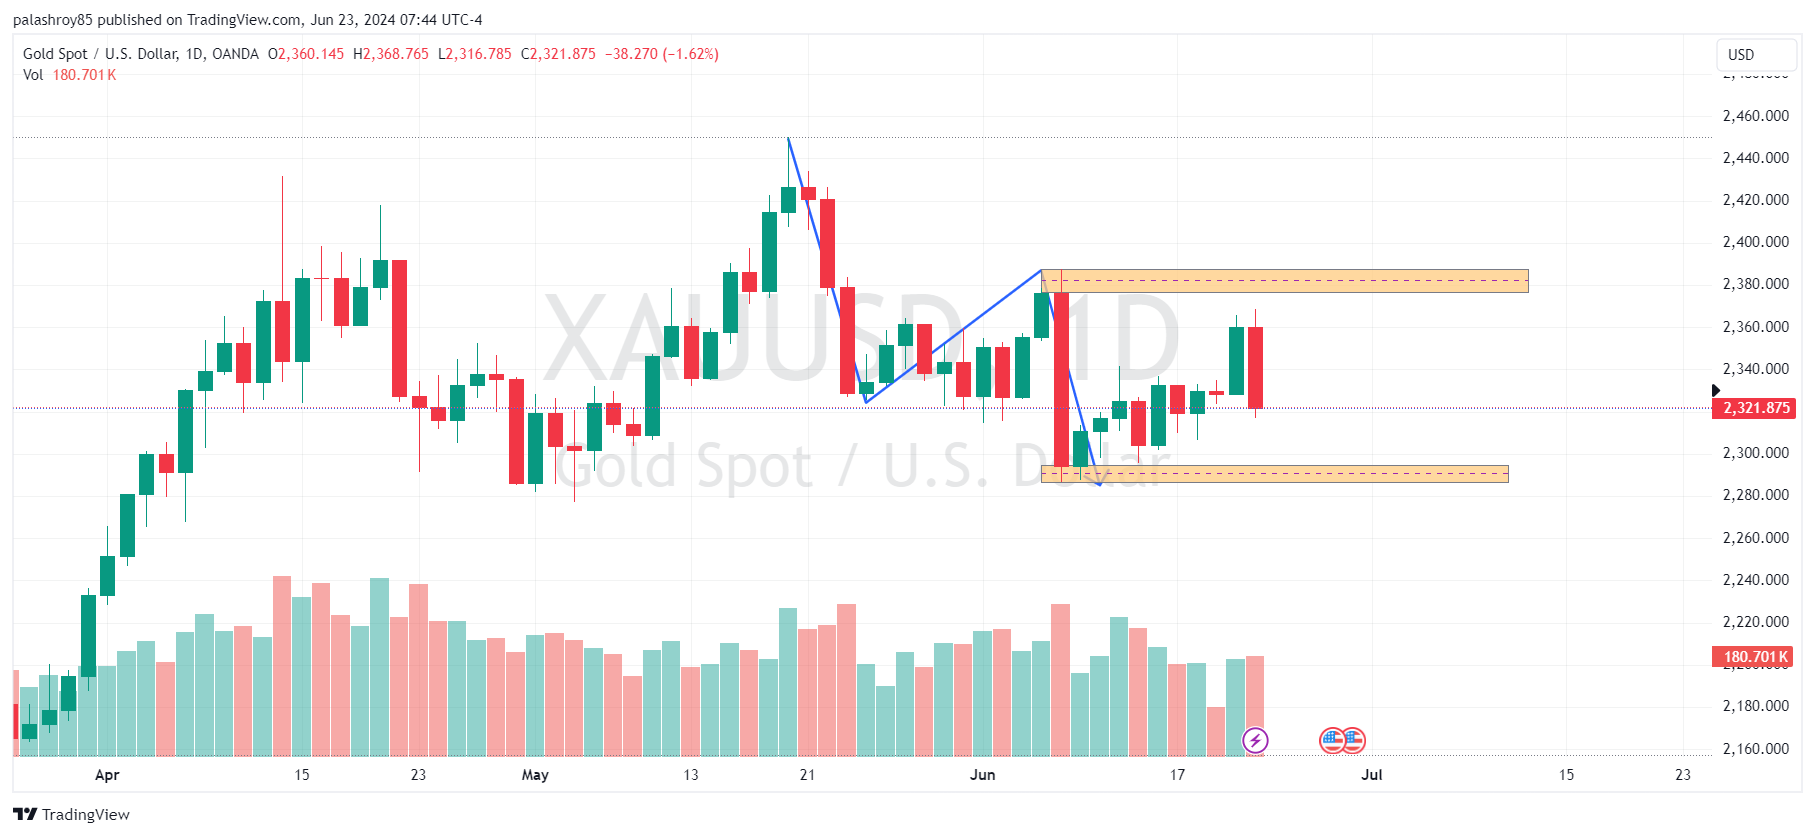
In the daily timeframe, the structure of gold is creating lower lows and lower highs. A significant resistance zone is identified between 2377 and 2387. As long as the price stays below this zone, the outlook remains bearish. Should the price break above this zone, a bullish stance on gold would be adopted for the long term. If the price reaches this resistance zone, consider selling with proper stop-loss (SL) for the long term.
On the support side, the zone between 2286 and 2294 is very strong. The 2286 level is particularly significant across monthly, weekly, and daily frames. If the price reaches this zone, buying for small profits could be a viable strategy due to the current bearish sentiment in the market.

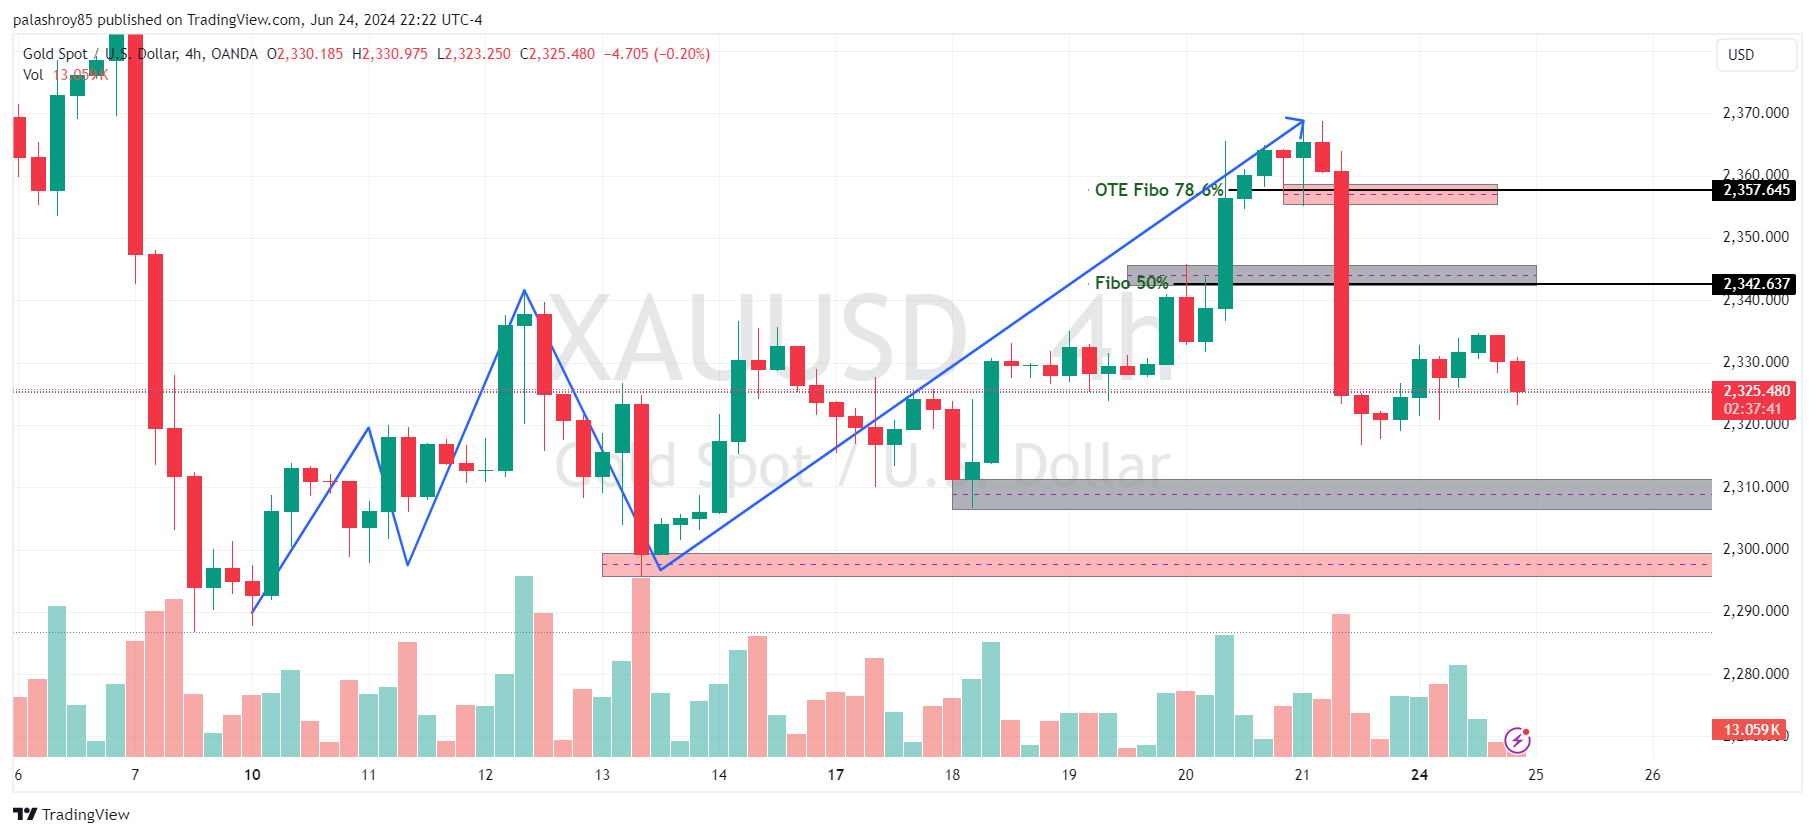
In the 4-hour timeframe, the structure remains bullish. The critical support zone is between 2296 and 2300. Until this support is broken, selling gold for swing trades is not advisable.Using Fibonacci retracement for the last swing, the 50% retracement is at 2342.50 and the Optimal Trade Entry (OTE) retracement level is at 2357.50. If the price approaches these levels, selling for intraday purposes after confirming evidence would be a good strategy. Additionally, there is a demand zone between 2306 and 2310. Buying at this level for small profits is recommended, considering the strong support and demand zone between 2296 and 2300.

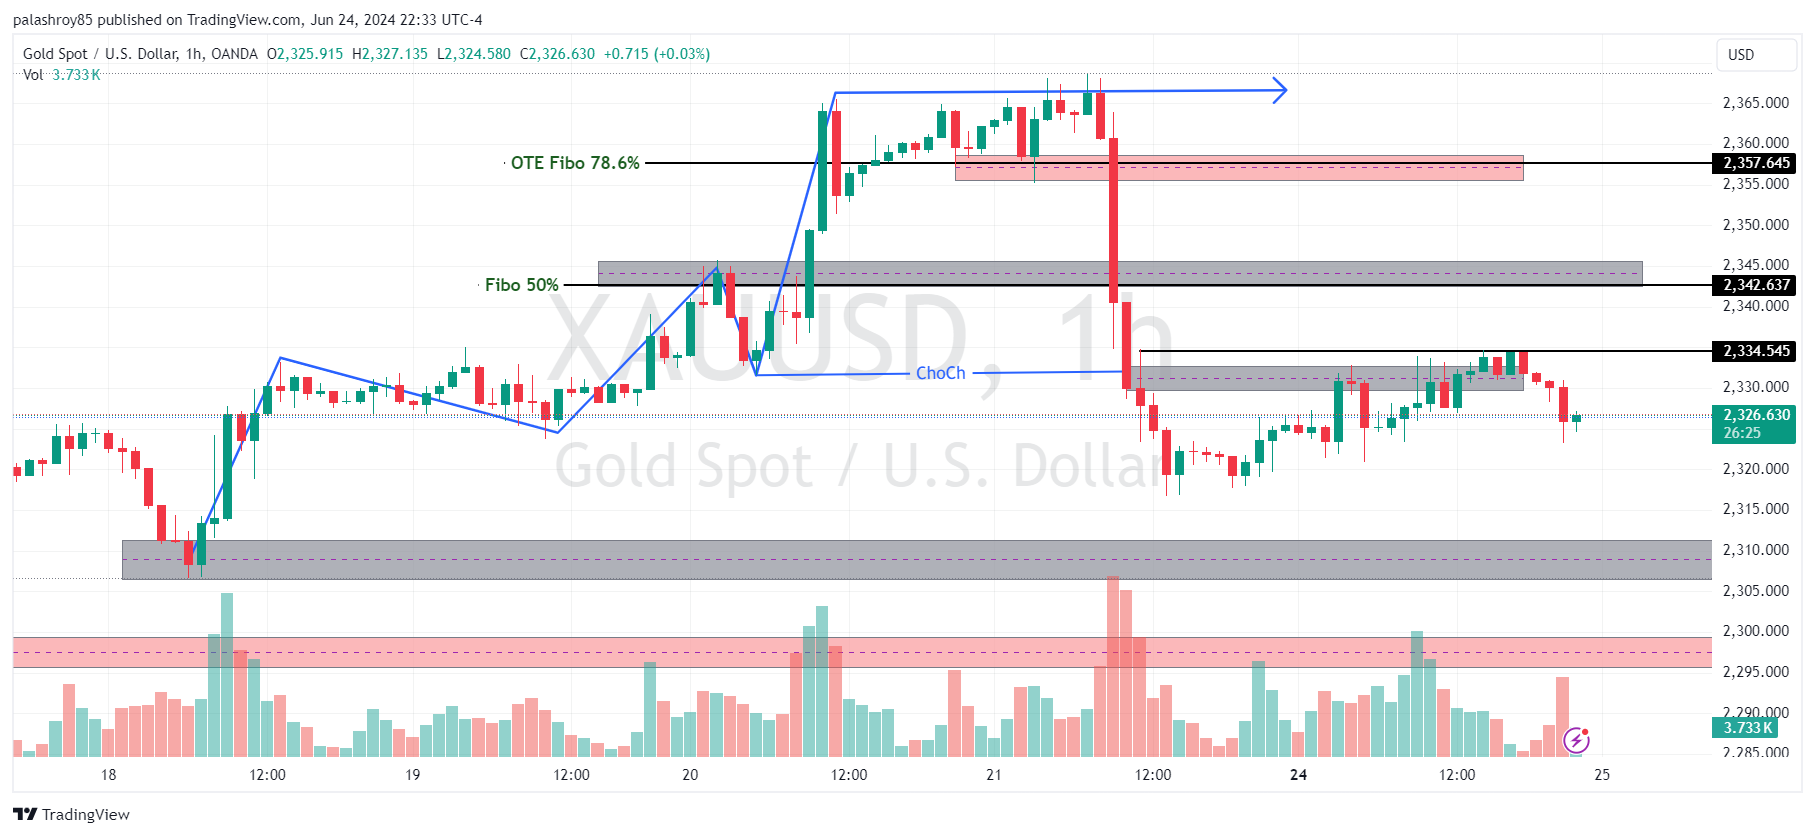
The 1-hour timeframe has shown a Change of Character (CHoCh), indicating a shift to a bearish trend. After forming a CHoCh, three Points of Interest (POIs) are identified to join the current trend. The market has already sold off from the first POI at 2329-2333. The next POI is between 2342 and 2345, coinciding with the 50% Fibonacci retracement, making it a strong selling point upon confirmation.

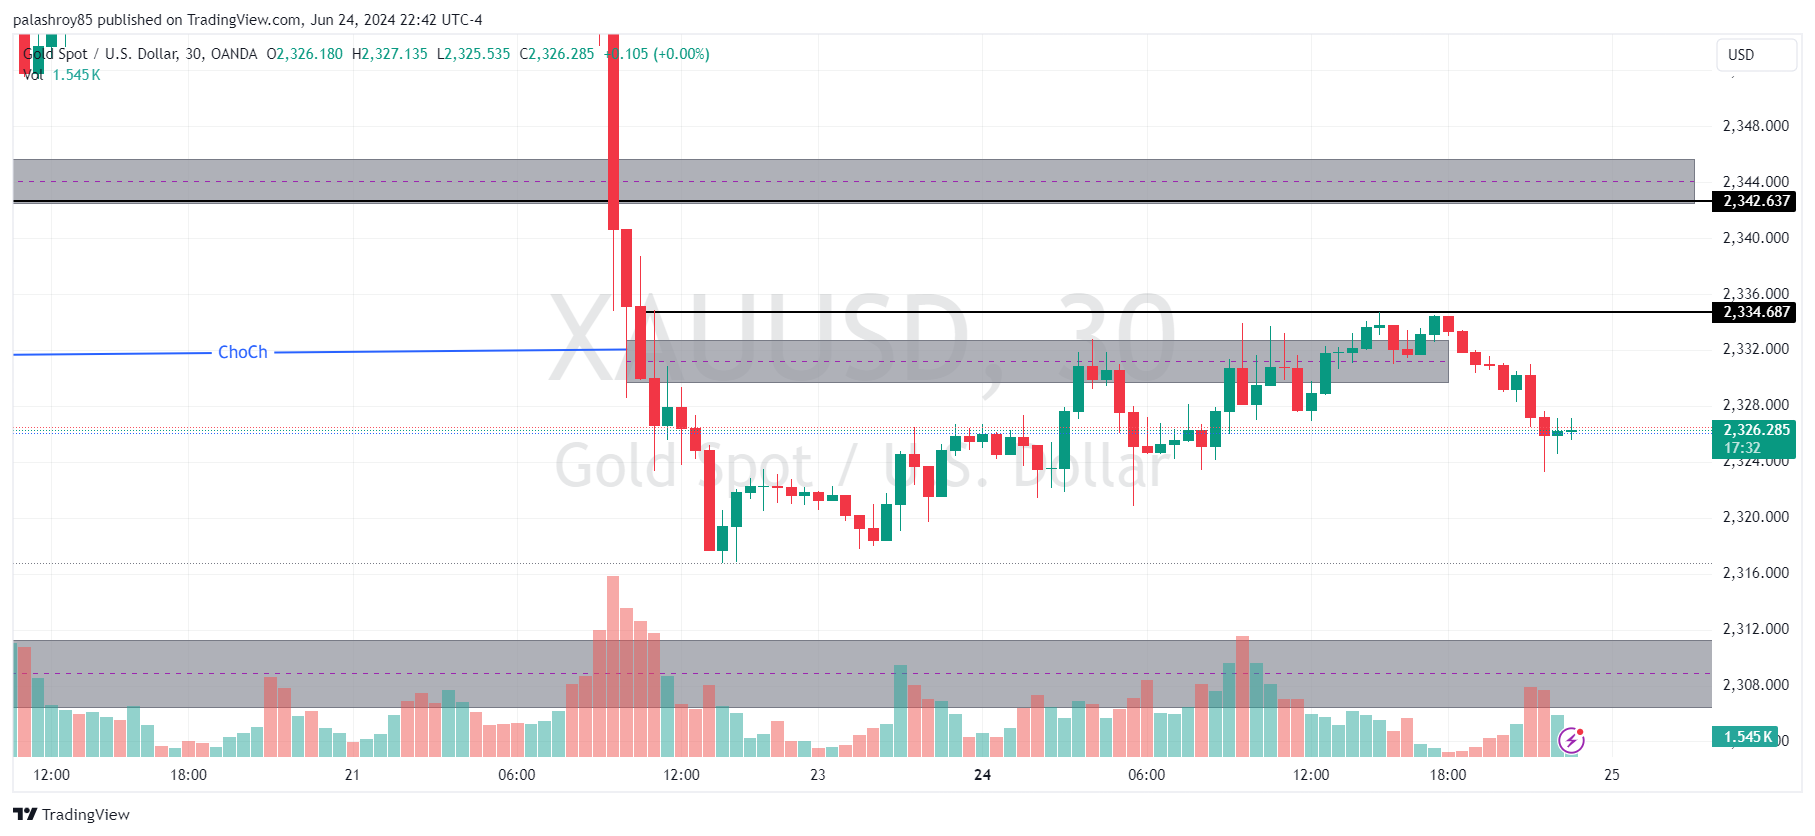
In the 30-minute frame, 2334.68 is a significant resistance level. The price has nicely rejected from this black horizontal line. If the price breaks and closes above 2334.68, a small buy on the retest could be considered.

This analysis highlights key support and resistance zones across different timeframes, providing a comprehensive outlook for trading gold (XAUUSD) ahead of the US CB Consumer Confidence report. Remember to validate this analysis with your own research and practice on a demo account before trading live.
Stay updated with our latest analyses and insights into the Forex market. If you have any questions or suggestions, feel free to contact us or leave a comment below.
Comments