THE FOREX TRENDS
Revealing the World of Forex: Expert Analysis and Secrets of successful trading
Yesterday at 7:30 PM IST, the USA ISM Manufacturing PMI data was released, showing results lower than forecasted. This indicates a slight cooling down in the US economy. Despite this, market sentiment remains "higher for longer," and Federal Reserve members maintain a hawkish stance on the currency.
Immediately following the news release, a slight bearish trend was observed in the DXY. However, aligning with market sentiment, the DXY turned bullish again. According to the daily structure, there is strong resistance at 106.50 in the DXY. The price may test this zone before moving downwards. Consequently, we may see selling opportunities in XAUUSD if the DXY rejects this strong resistance.
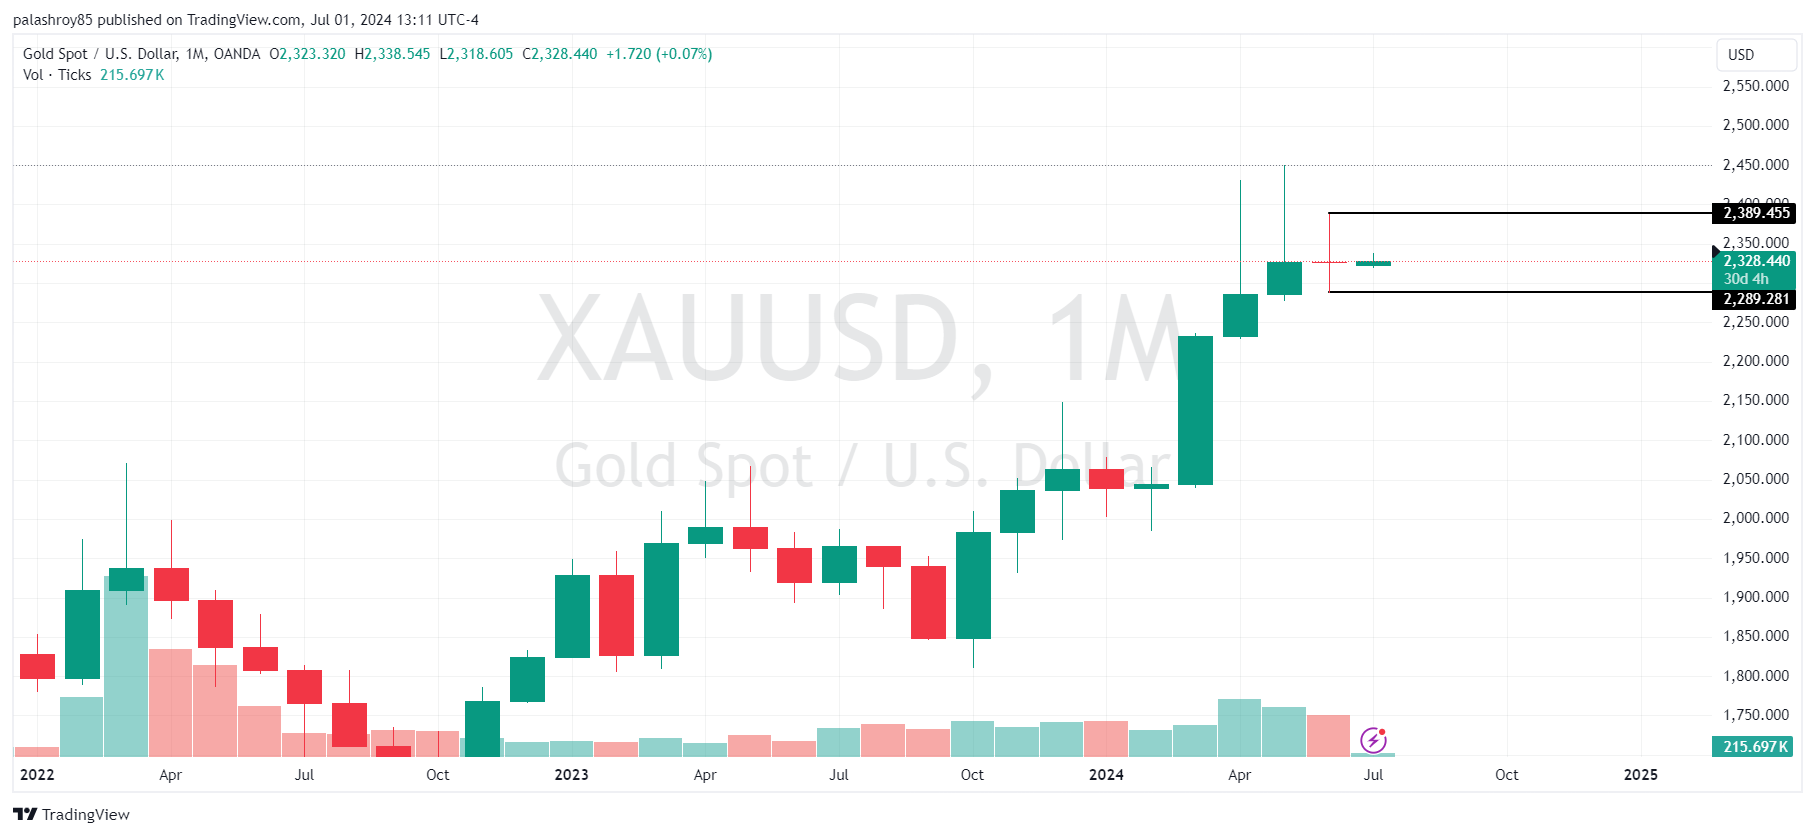
When analyzing gold on a monthly timeframe, the previous month's candle is an indecision or Doji candle. According to my strategy, I mark the high and low of the Doji candle. After a breakout above the high or below the low, the market usually finds a clear direction. If the price closes above the previous month's Doji candle’s high, we can expect a bullish trend.
Conversely, if the price closes below the Doji candle's low, a bearish trend is likely. This strategy is effective for swing trading or positional trading purposes as it is monthly time frame.

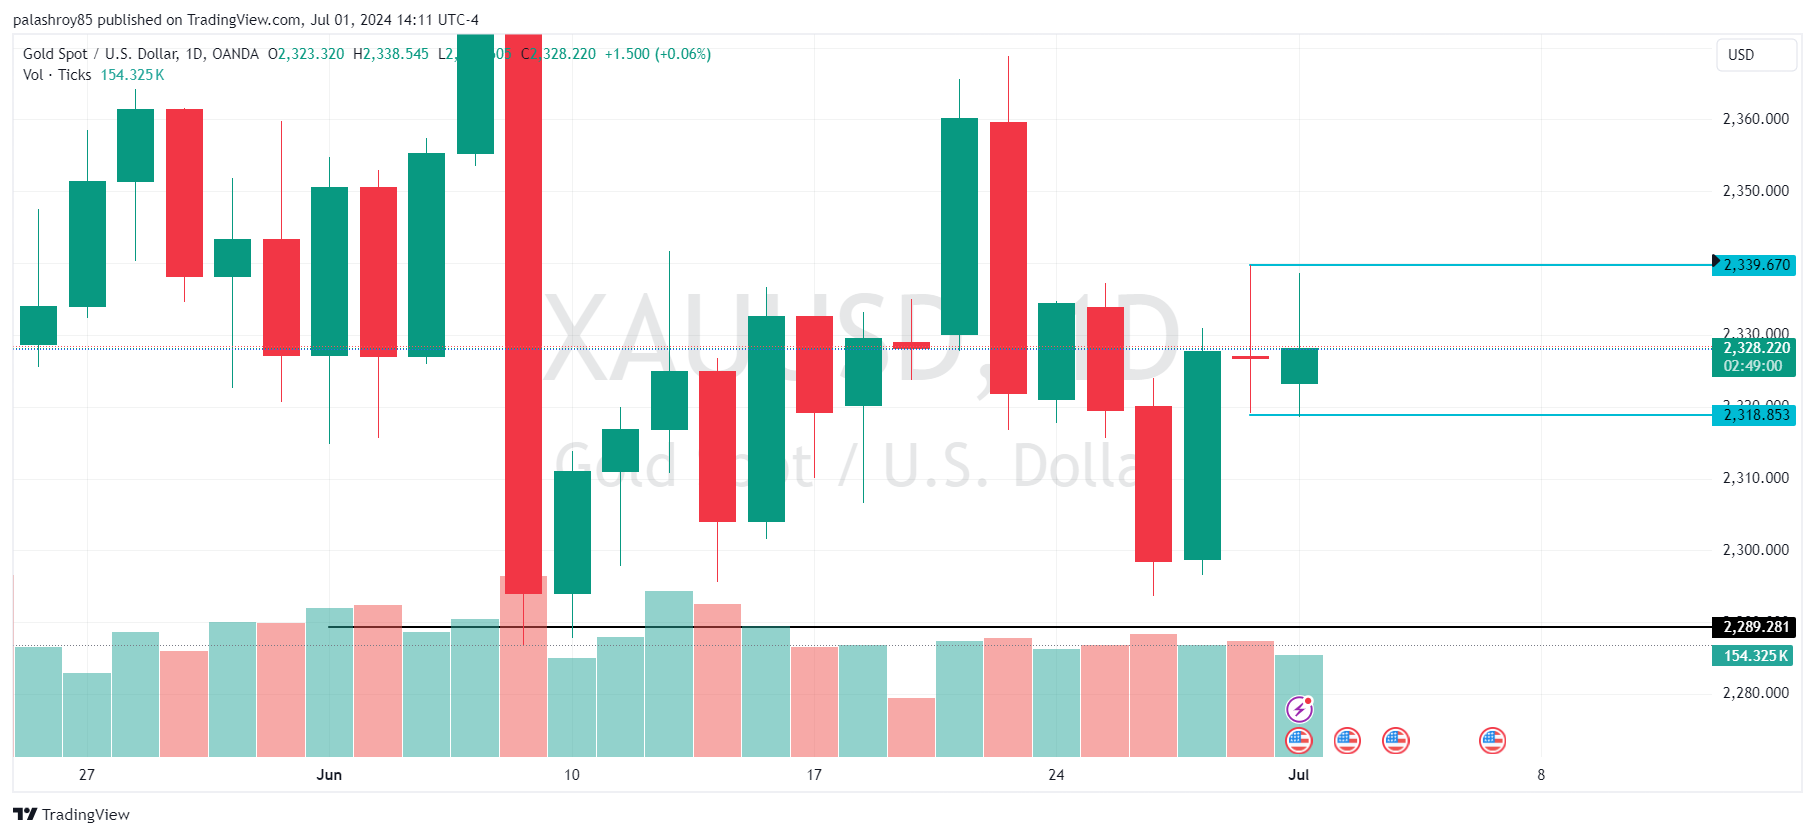
Analyzing gold on the daily timeframe, you'll notice that the last day's candle, which was last Friday, also formed a Doji candle. Following our strategy, I've marked the low of the Doji candle at 2318.58 and the high at 2339.67. If the price breaks out of these levels on the daily timeframe, we can expect a bearish or bullish direction, respectively.
For the next few days, we need to monitor the daily candle closing. If the price closes below 2318.58 on the daily timeframe, our sell-side target will be 2289. On the other hand, if the price closes above 2339.67 on the daily timeframe, our buy-side target will be 2387.58.

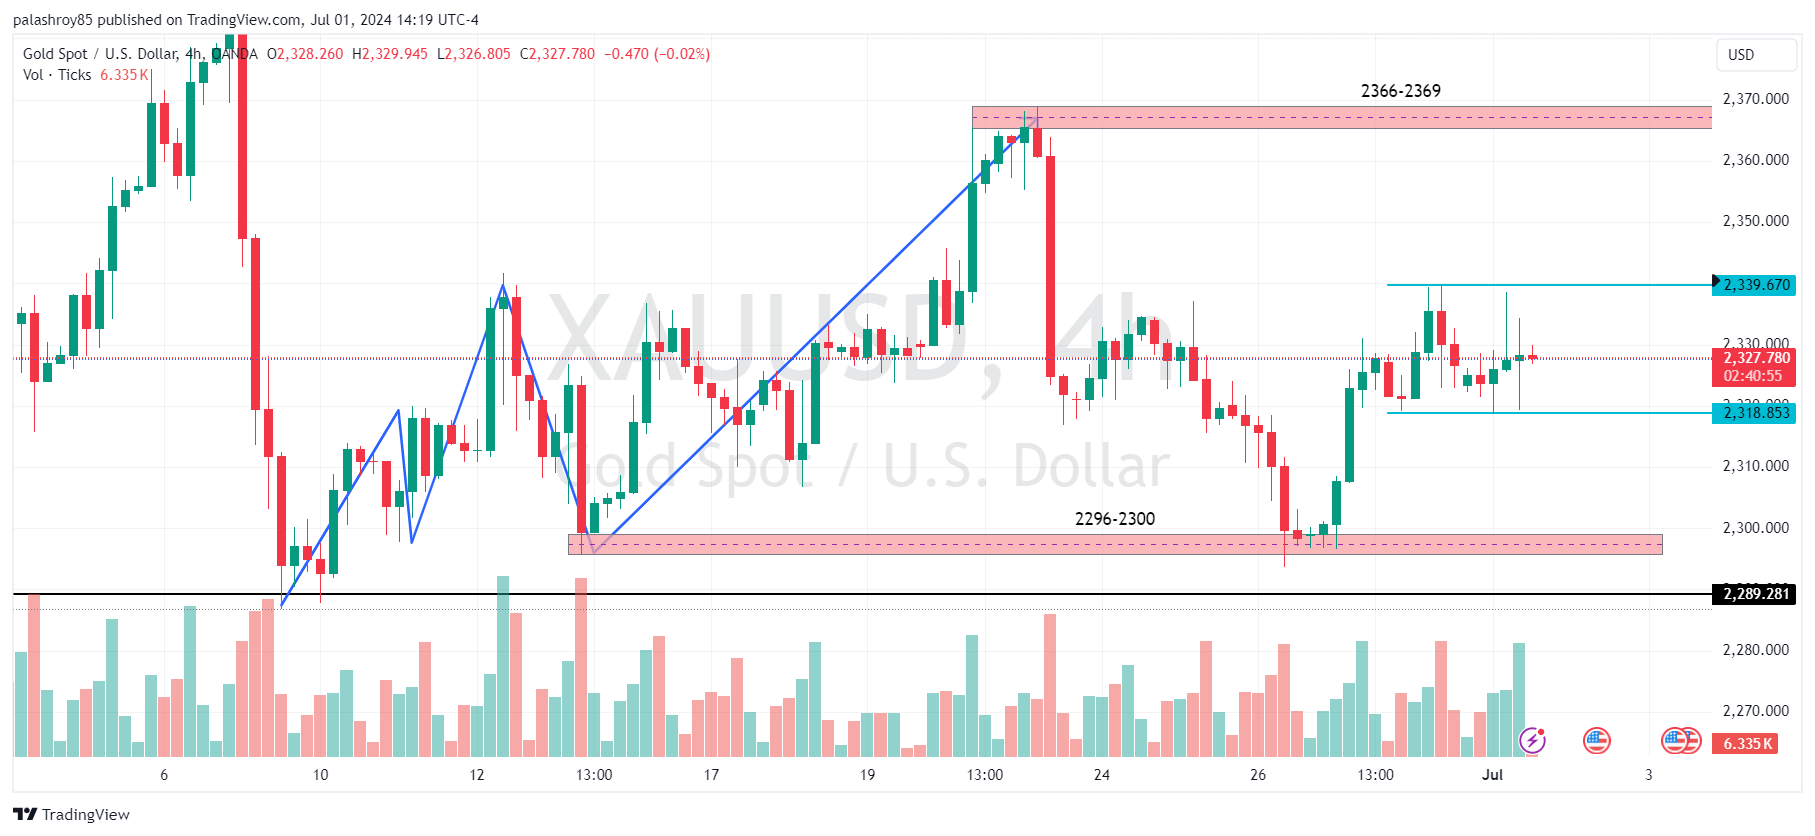
When analyzing the market structure on the 4-hour timeframe, you'll see that the market is bullish. According to the 4-hour frame structure, the 2296-2300 level serves as a last resort of support, and the 2366-2369 level is a good resistance. The price has respected the 2296-2300 support level well, providing good buy opportunities as mentioned in my previous analysis.
Currently, if the price approaches the 2366-2369 resistance level, we might see some retracement. From this zone, we can expect a sell opportunity for a profit of 100 to 150 pips.

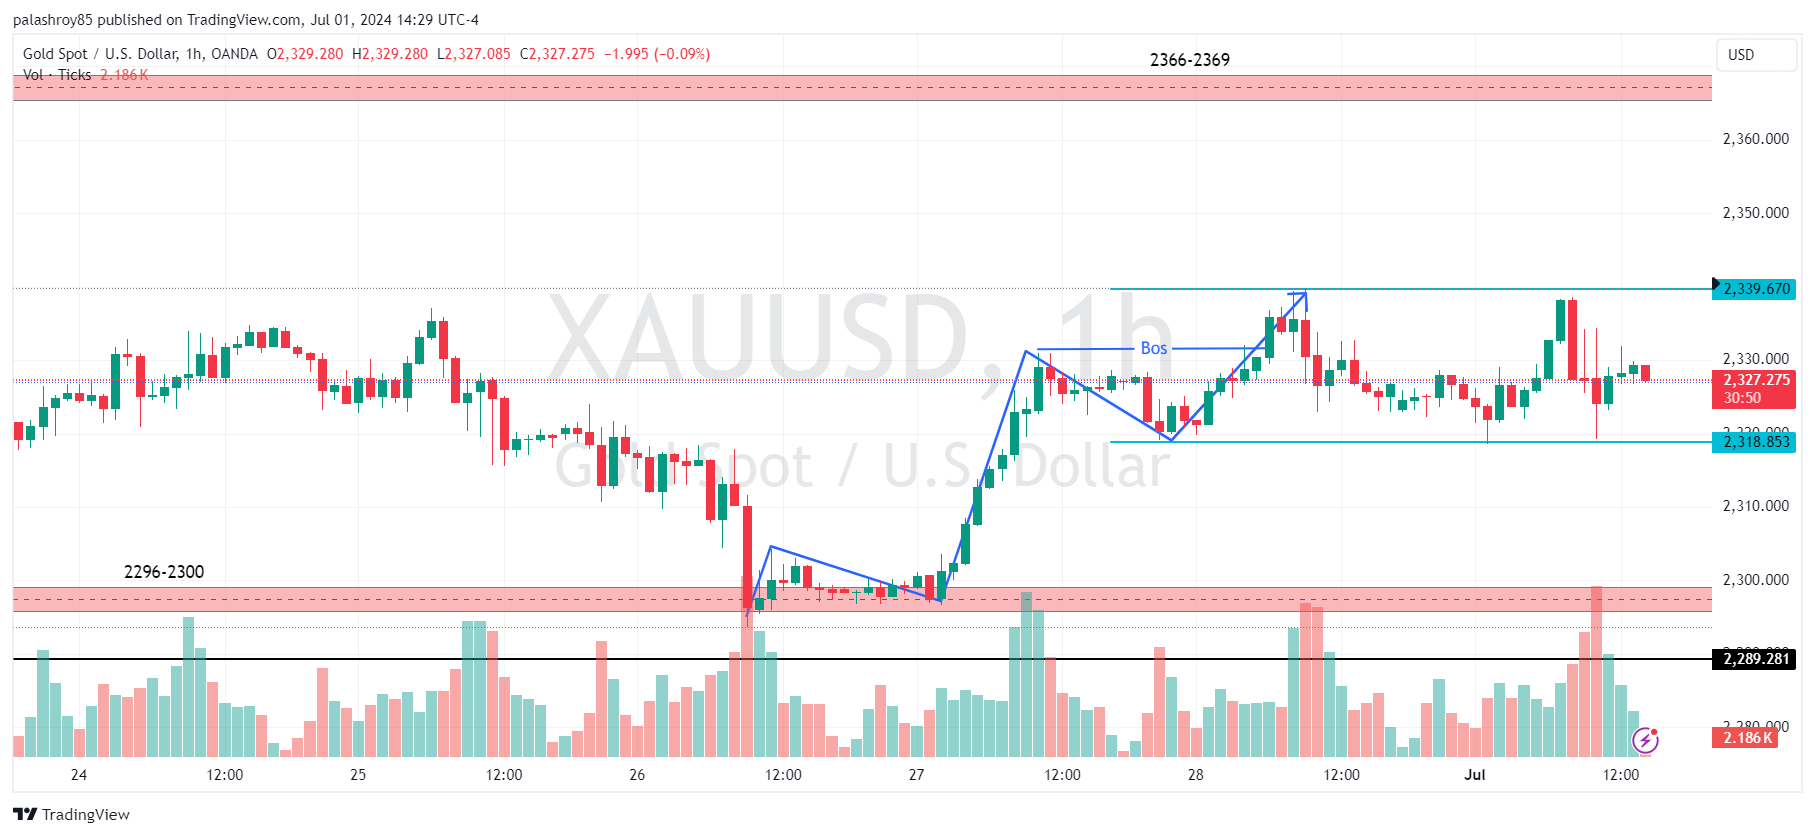
For intraday trading, we need to analyze smaller time frames. Let's look at potential trade setups on the 1-hour timeframe. If we mark the structure, you'll see a bullish structure developing, with a Break of Structure (BOS) already created.
After creating a BOS, we have two Points of Interest (POI) to join the existing trend. Our first POI is at 2318, from which the market has already provided a good buy trade.
However, if we observe, the low of the previous day's Doji candle acts as significant support at 2318.85. If the price breaks this support with momentum candles, we can take a sell trade on the retest, with our first target at 2300.
Conversely, if the price breaks the resistance level at 2339.60 with momentum candles, we can take a buy trade for intraday purposes, targeting 2365.

This analysis provides a comprehensive outlook on XAUUSD, combining technical insights with upcoming economic data. It's essential to perform your own analysis and practice on a demo account before engaging in live trading. The market can be unpredictable, and proper preparation is crucial for success.
Stay updated with our latest analyses and insights into the Forex market. If you have any questions or suggestions, feel free to contact us or leave a comment below.
Comments