THE FOREX TRENDS
Revealing the World of Forex: Expert Analysis and Secrets of successful trading
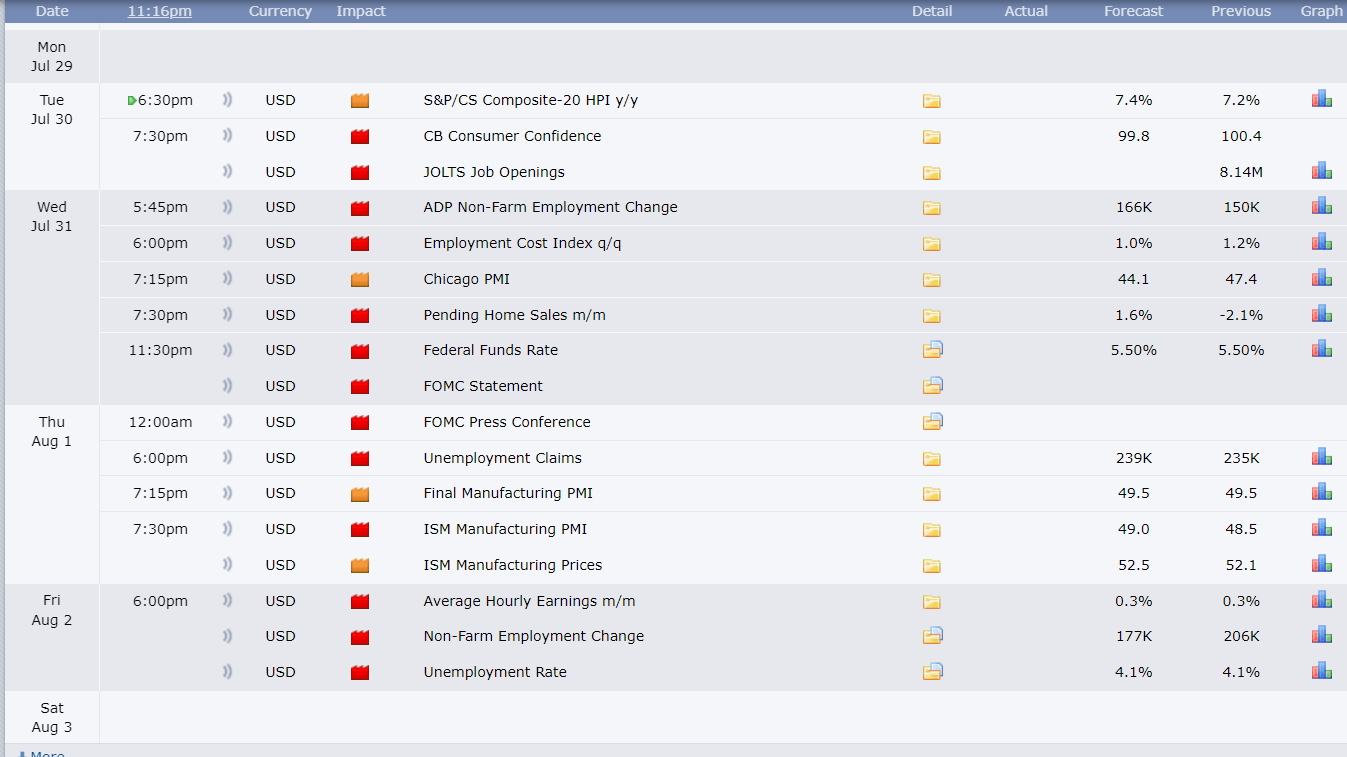
The market sentiment remains consistent with the expectation that the Federal Reserve will soon start cutting interest rates. However, this week's interest rate expectation remains the same as before, at 5.50%. According to the Fed Watch Tool, we may see the first interest rate cut during the September FOMC meeting.
Ultimately, we will continue to see bearishness in the DXY as the sentiment remains intact. However, we need to carefully monitor the labor market conditions this week. Key data releases for NFP (Non-Farm Payroll) and other employment-related data will be crucial. If the upcoming labor market data shows an unexpected slowdown, the Fed may cut interest rates very aggressively.
We may also get some hints from the FOMC statement this week regarding a rate cut. If this happens, we could see aggressive selling in the DXY.

Additionally, from a technical perspective, this week the monthly candle will close. This closing will also determine the next month's movement for the DXY as well as gold.
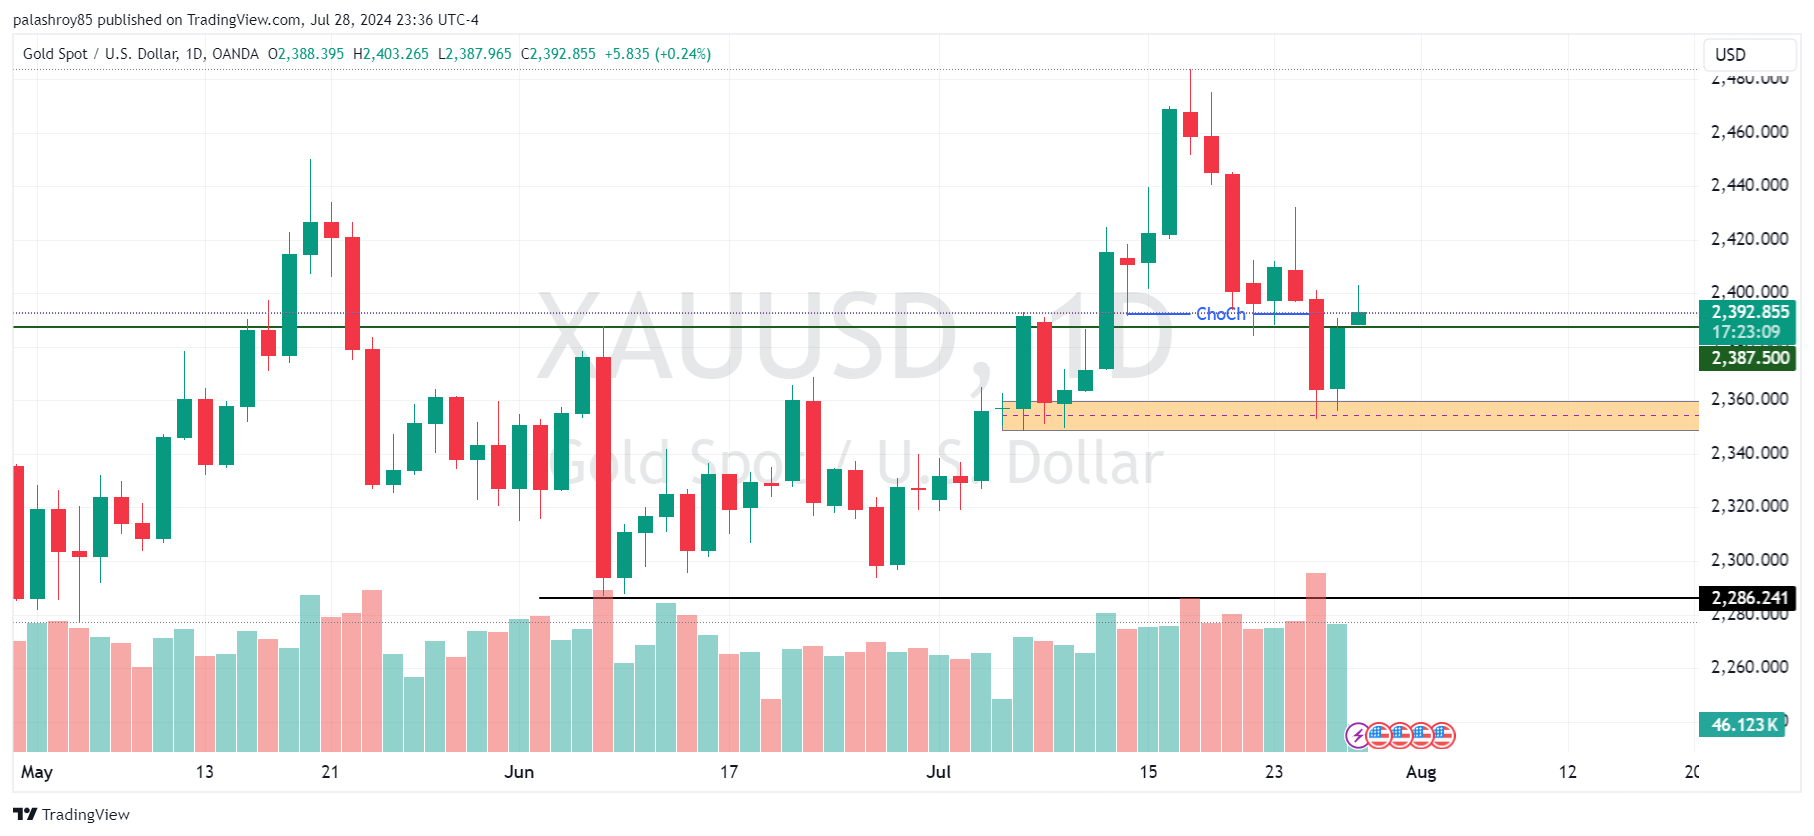
In my previous analysis, I highlighted some key points regarding last month's candle. If this month's candle closes below 2387.50, we may see further correction in gold next month. Conversely, if this month's candle closes above 2387.50, we may witness another bull run in gold.
Looking at the weekly candle, last week's candle appears to be an indecision type of candle. However, the week before last showed a clear sign of bearishness. Despite this, buyers have regained significant control in the previous week.
On the daily time frame, the price has bounced back from a major support level. According to the advanced market structure, there is a Break of Structure (BOS) at the 2348-2359 level. Based on the daily and weekly frames, we may see further bullishness in gold for this week.

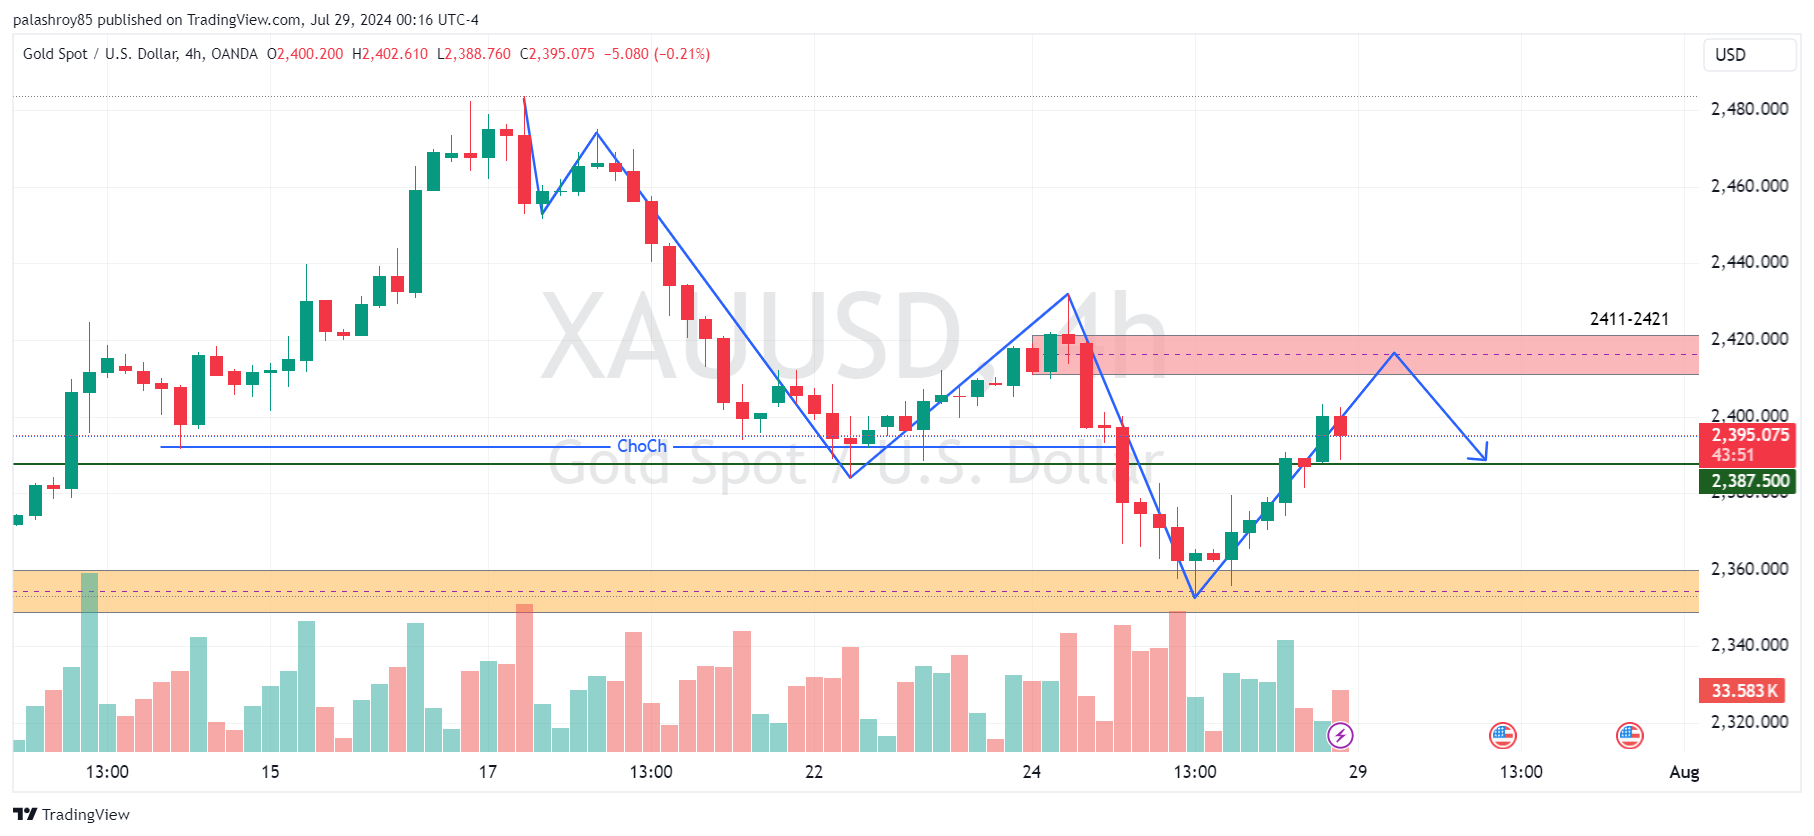
Technically, if we look at gold on the 4-hour time frame, it has now formed a Change of Character (ChoCh), shifting from a bullish bias to a bearish bias. When the market shifts in this manner, we typically have three levels to join the current bearish trend. The level we have to join this bearish movement is 2411-2421, which is a Quasimodo level (QML). Additionally, there is an unmitigated order block at this QML level. If the price reaches this level this week, we may initiate a sell from here after getting some candlestick evidence.
On the other hand, if the price breaks this level with momentum candles, we may initiate a buy after a retest of this zone for the double top level. If the price drops back to the daily support level again, we will not initiate a buy from there. In that scenario, we will wait for a breakout of the daily support level (2350-2360), and after the breakout, we may initiate a sell after a retest of the daily support zone.

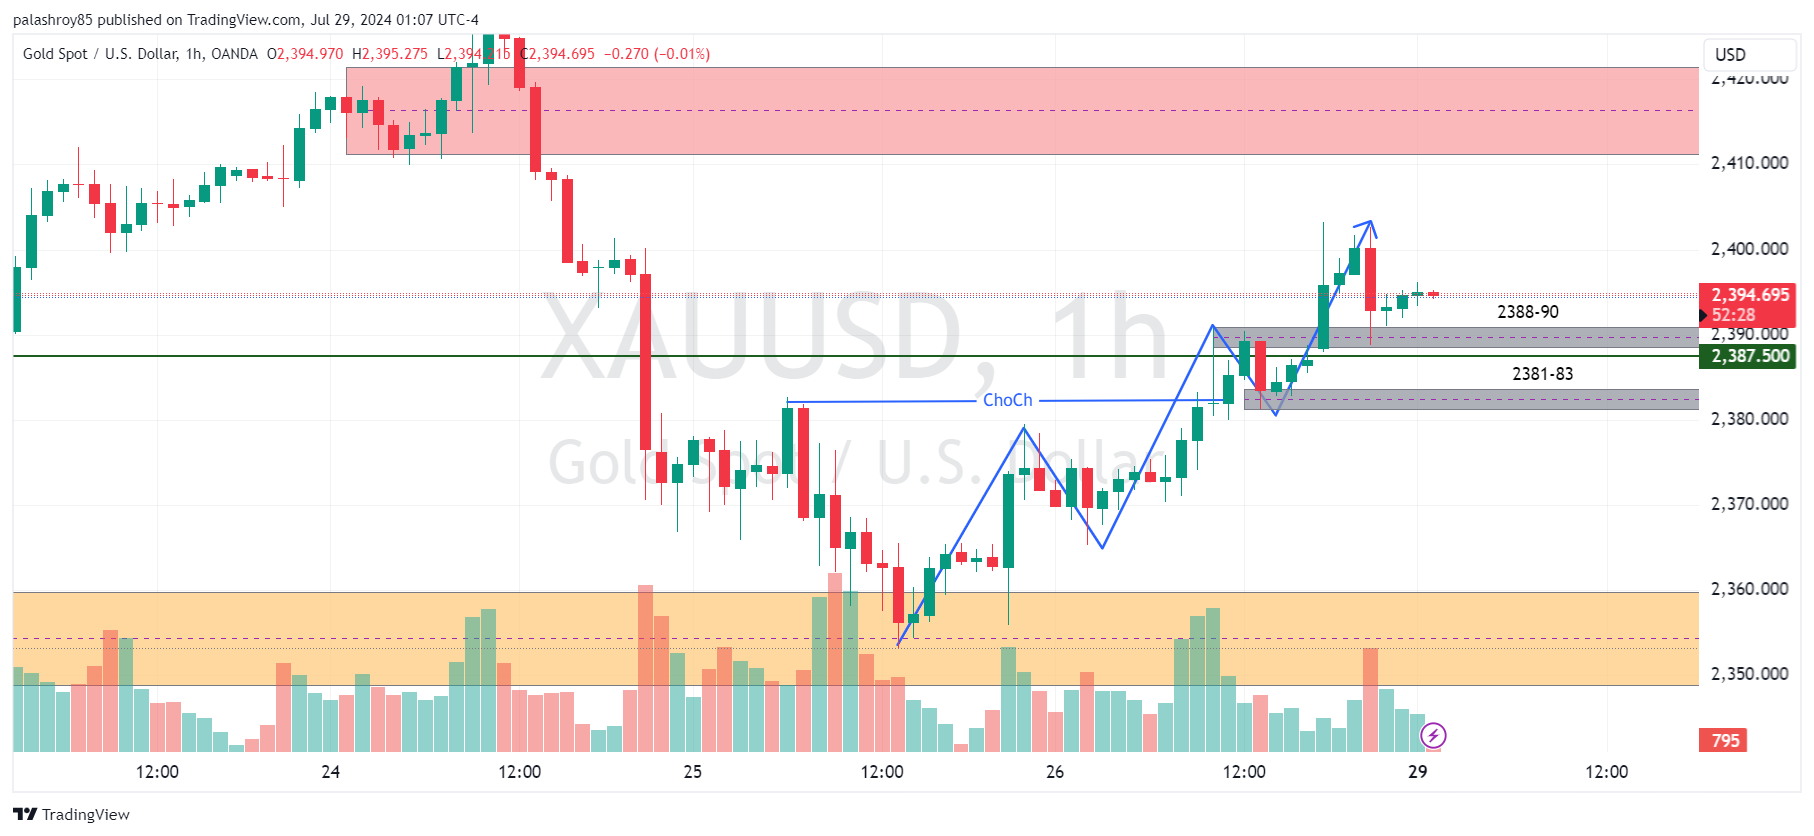
Let's look at the 1-hour frame to identify intraday trading opportunities in the gold market for today and tomorrow. As seen in the image below, gold has formed a bullish Change of Character (ChoCh). However, we are bearish on the 4-hour frame from the 2410-2420 level. Therefore, we may look for some buy opportunities up to that 4-hour resistance level.
As we know, the market is usually slow on Mondays. Additionally, there are no significant news releases today, so the market is expected to be slow. For intraday trading, we should aim for small profits with small stop losses.
By marking the internal structure on the 1-hour frame, we can see a bullish structure. At the last Break of Structure (BOS), we have two Points of Interest (POIs) to join this bullish trend. The first POI at the 2388-90 level has already shown a response, so if we get the price at this zone again, we may look for a small buy with some evidence.
Our second POI for a buy trade is at the 2381-84 level. If the price reaches this zone today or tomorrow before the New York session, we may initiate a buy from this level.
If the price breaks this last support of the 1-hour structure, we may look for a sell after a retest down to our daily structural support.

This analysis provides a comprehensive outlook on XAUUSD. It's essential to perform your own analysis and practice on a demo account before engaging in live trading. The market can be unpredictable, and proper preparation is crucial for success.
Stay updated with our latest analyses and insights into the Forex market. If you have any questions or suggestions, feel free to contact us or leave a comment below.
Comments