THE FOREX TRENDS
Revealing the World of Forex: Expert Analysis and Secrets of successful trading
Yesterday, US Federal Reserve Chair Jerome Powell testified before the Senate Banking, Housing, and Urban Affairs Hearings to discuss the Semiannual Monetary Policy Report to Congress. During his testimony, Powell remarked that inflation has been improving in recent months, and that positive economic data could further support the case for interest rate cuts.
“More good data would strengthen our confidence that inflation is moving sustainably toward 2%,” said Powell. “After a lack of progress toward our 2% inflation objective in the early part of this year, the most recent monthly readings have shown modest further progress.” He added, “Reducing policy restraint too late or too little could unduly weaken economic activity and employment.”
Based on Powell's statements, my opinion is that a rate cut is likely this year if inflation sustain at its current levels. Maintaining high interest rates for an extended period could reduce economic activity.
Given this outlook, the overall sentiment among traders is that the DXY (US Dollar Index) will ultimately decline by the end of this year, although it may take some time.
Gold 4-Hour Frame Technical Analysis
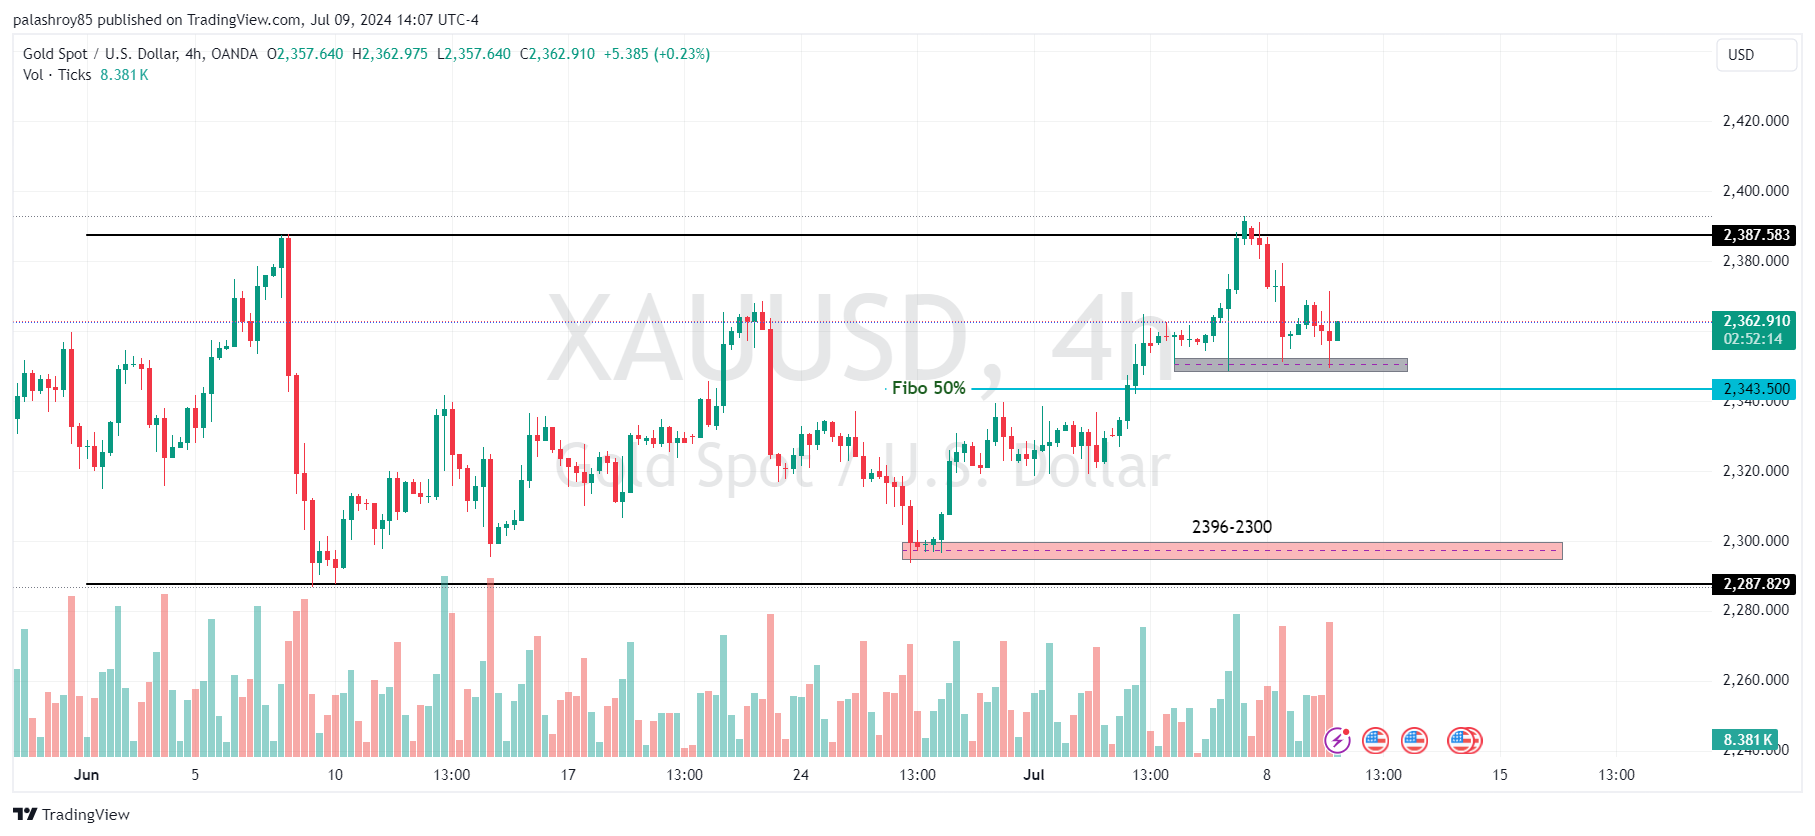
Analyzing gold on the 4-hour frame, we see that the market structure is strongly bullish. According to the recent market structure, we have two Points of Interest (POI) to join the existing trend. The first POI is at the 2365-2368 level. However, yesterday the price broke this POI. As per market structure rules, we may look for selling opportunities up to the second POI. If we see strong evidence, we can consider selling at the breakout of 2343, which is the 50% Fibonacci retracement level and a potential bounce area.
Our second POI is at the 2296-2300 level. Since the price has broken the first POI, we may see it drop to the last 4-hour structural support at the 2296-2300 level. If the price reaches this level, we can look for a buying opportunity after confirming evidence.
On the other hand, the 2296-2300 level is also our last structural support. If the price breaks this support with momentum candles, we may see another significant sell-off in gold for the long term.

Intraday/Scalping Trading Possibilities for Gold on 1-Hour Frame
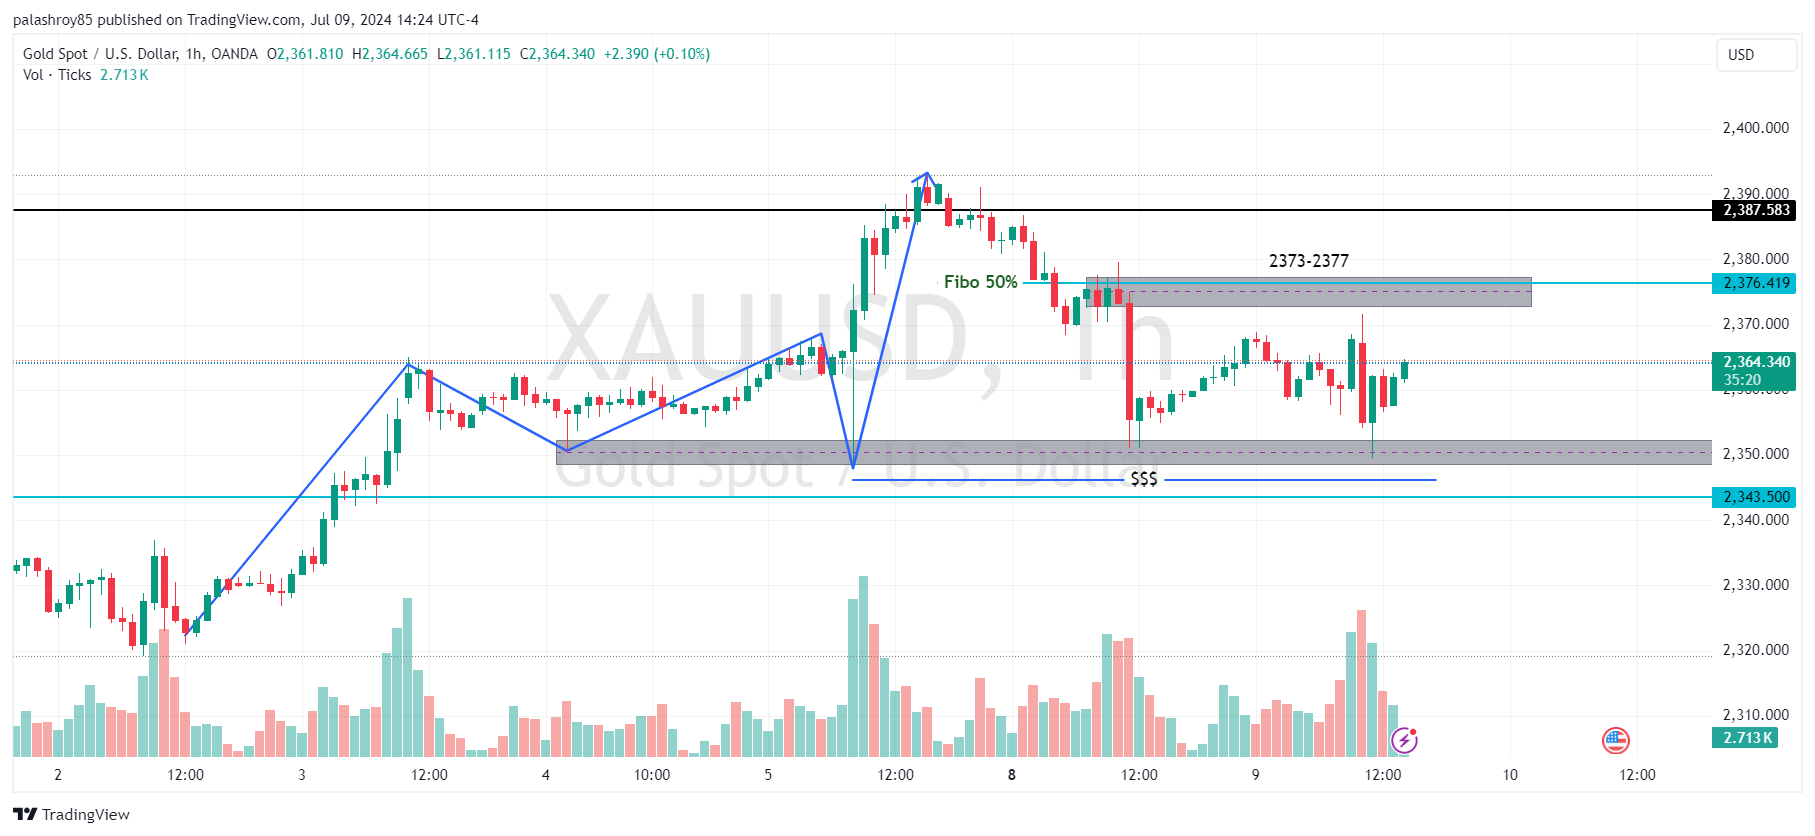
When drawing the market structure on the 1-hour frame, it's clear that the market is bullish. According to this structure, our last support area is at 2348-2352, which the price has tested four times. If you look closely, the price has created relative equal lows at this level. Typically, when the market forms such equal lows, a liquidity zone forms just below, and the market often grabs this liquidity before moving back up.
Additionally, at 2343, there is a 50% Fibonacci retracement level from the 4-hour frame. This increases the possibility that the price might grab liquidity and test the Fibonacci level before heading upwards.
For potential selling opportunities in XAUUSD, there's a significant supply zone at 2373-2377. This zone is also a point of interest in the internal structure in 1-hour frame. Moreover, if we plot the Fibonacci retracement on the last bearish swing, we find the 50% retracement level at 2376. Therefore, the 2373-2377 zone presents a good selling opportunity if the price approaches this

This analysis provides a comprehensive outlook on XAUUSD, combining technical insights with upcoming economic data. It's essential to perform your own analysis and practice on a demo account before engaging in live trading. The market can be unpredictable, and proper preparation is crucial for success.
Stay updated with our latest analyses and insights into the Forex market. If you have any questions or suggestions, feel free to contact us or leave a comment below.
Comments