THE FOREX TRENDS
Revealing the World of Forex: Expert Analysis and Secrets of successful trading
The recent release of the USA's GDP data revealed a slight increase compared to the previous quarter. This indicates that the US economy remains robust, suggesting that inflation may not cool down soon. Consequently, the Federal Reserve is unlikely to cut interest rates, leading to a market sentiment of 'higher for longer.' This scenario could result in further selling pressure on gold and potential bullishness for the DXY (US Dollar Index).
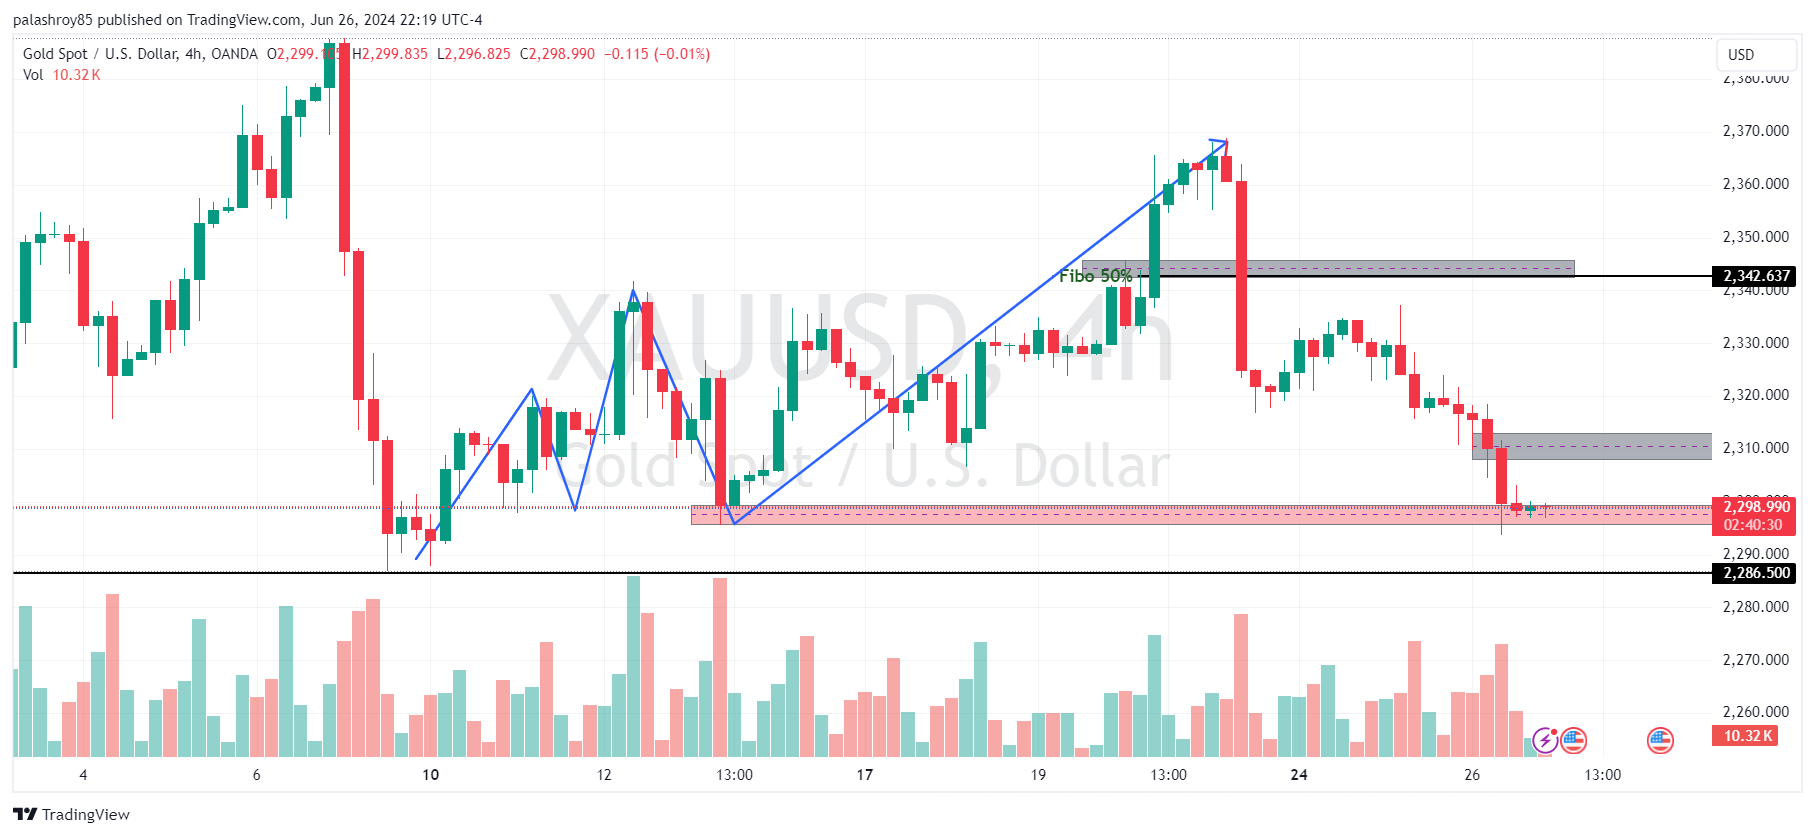
If we look at gold on the 4-hour frame, it is still bullish as per the market structure. The 2295-2300 level is the last resort of support on the 4-hour frame, and the market has taken support from there and moved up. I mentioned in the previous analysis that this is a strong buy zone. If the price breaks this support and closes below 2294 with two candles on the 4-hour frame, we will turn bearish for the long term.
If I draw the internal structure on the 4-hour frame, 2334-2337 is our POI (point of interest), and we can look for a sell from this level if we get some evidence. The target for this sell would be 2310-2300.
On the other hand, if the price closes above 2368 on the 4-hour frame, we cannot look for selling opportunities for intraday purposes. So, until the market closes above 2368, we can look for selling opportunities in gold.

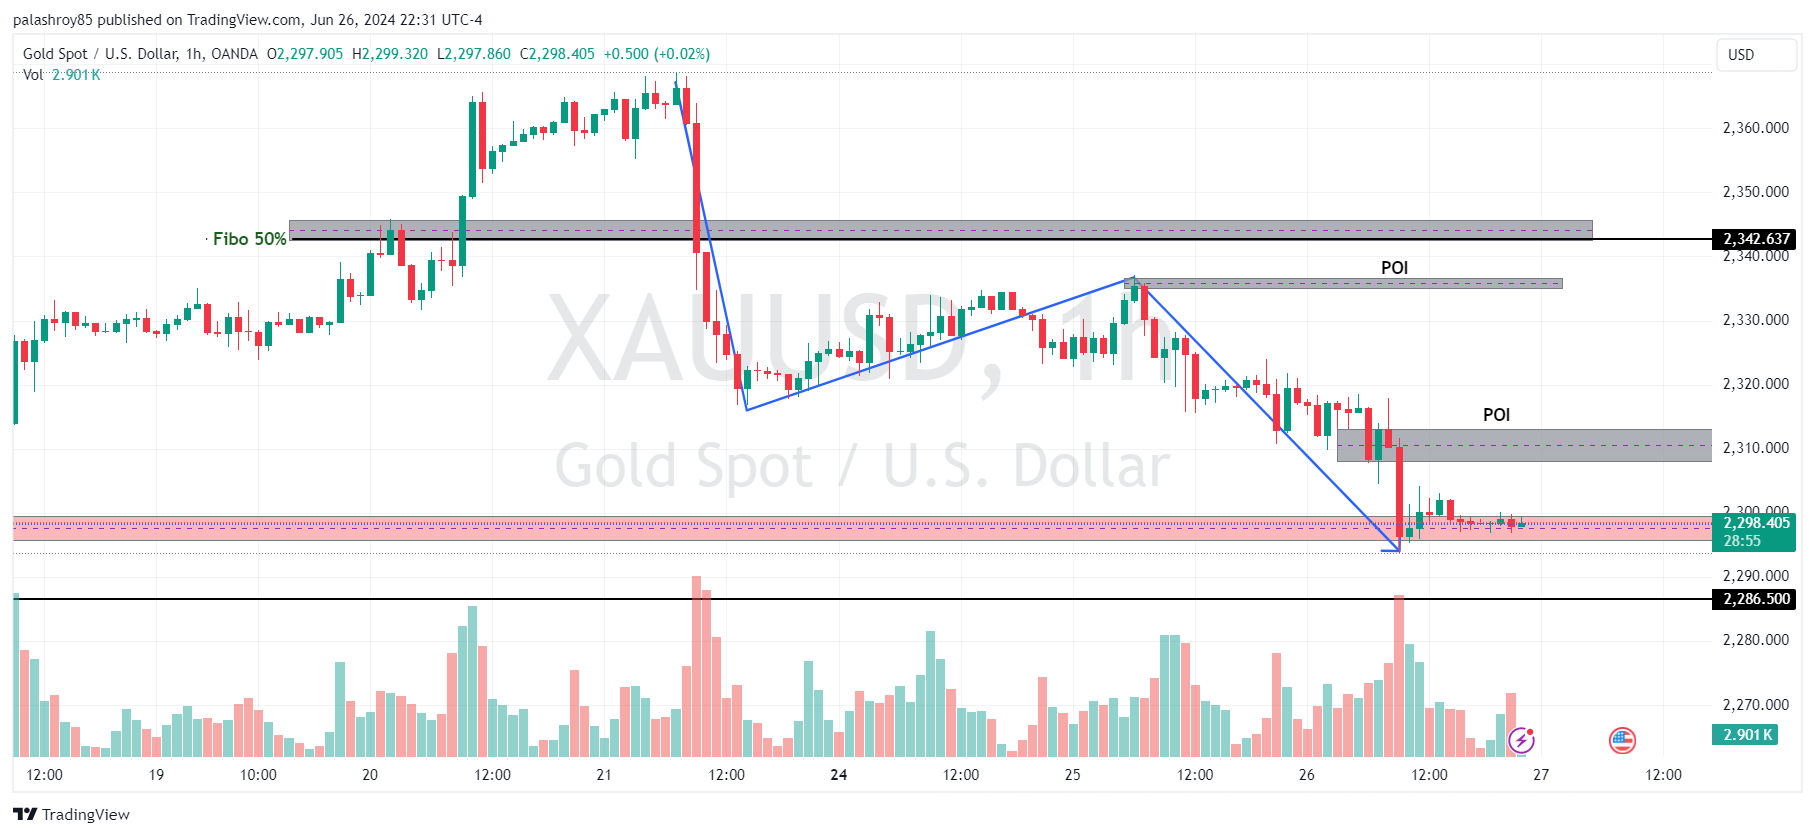
If we analyze gold on the 1-hour frame, you'll see that the price is currently in a strong supply zone. From 2335-2337, the price might drop. If we get some evidence at this level, we can initiate a sell.
If the price closes above the 2335-2337 zone, we have a pending retracement and a fair value gap at 2342-2345. So, it's possible that the price may test this zone before coming down.
And if we draw the internal structure on this 1-hour frame, you'll see that a bullish structure is developing. According to the internal structure, if the price comes to the 2319-2321 zone, we can look for a buy opportunity after getting proper evidence.

This analysis highlights key support and resistance zones across different timeframes, providing a comprehensive outlook for trading gold (XAUUSD) ater US GDP Data Release and Upcoming Core PCE Price Index News. Remember to validate this analysis with your own research and practice on a demo account before trading live.
Stay updated with our latest analyses and insights into the Forex market. If you have any questions or suggestions, feel free to contact us or leave a comment below.
Comments