THE FOREX TRENDS
Revealing the World of Forex: Expert Analysis and Secrets of successful trading
Last week, we witnessed several high-impact news events. Notably, Fed Chair Jerome Powell testified, and the US CPI data was released, which showed a cooling trend beyond expectations. Additionally, the PPI data was also released. Powell mentioned that there is no specific inflation number in mind for rate cuts but expressed "some confidence" that inflation is heading lower. He also emphasized the need to be mindful of the labor market, which has shown considerable softening. A weaker labor market could impact the economy, potentially necessitating an earlier rate cut.
Based on last week's data, it appears that the US is nearing a victory in its battle against inflation. I believe we are likely to see at least one rate cut this year, possibly in September. However, global trader sentiment suggests there might be two rate cuts this year. If upcoming macroeconomic data, particularly labor market data, provides any indication, we could witness a strong decline in the DXY (US Dollar Index).
This week, several high-impact news events are lined up:
We will analyze each day's news and assess its potential impact and the sentiment it creates. Stay tuned for our daily analysis.
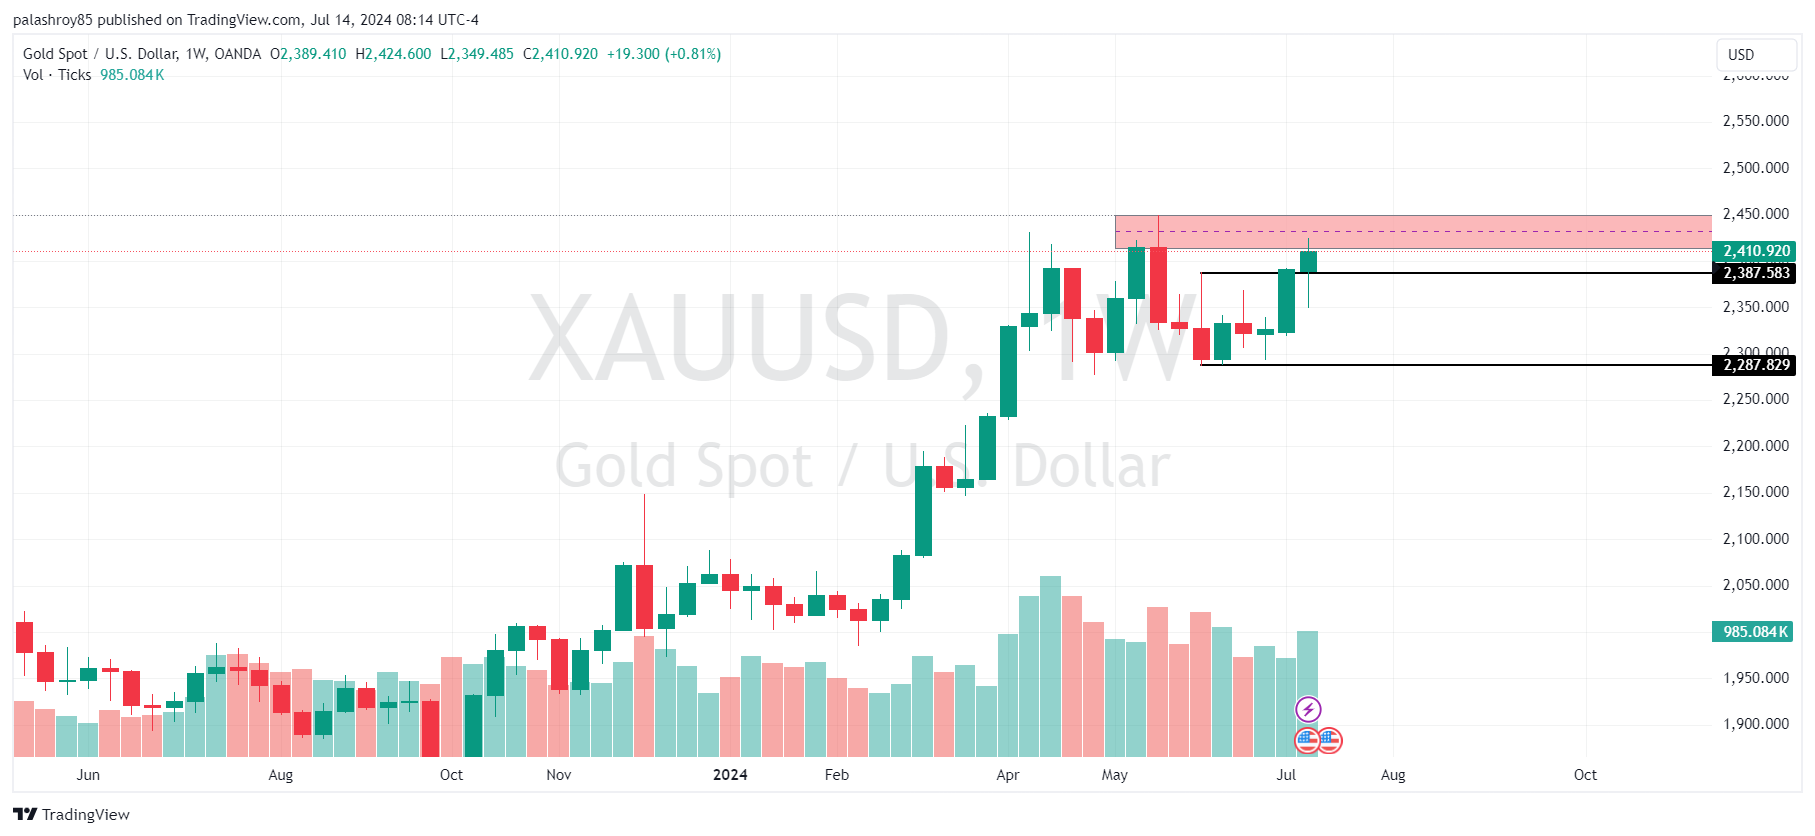
If we look at the weekly chart, we see a strong resistance level between 2420-2450. Within this zone, a triple top pattern seems to be developing, which is typically a bearish pattern. However, if the price manages to break through this resistance zone and closes above it, we could see a strong bullish direction.
Watch the video analysis here : Weekly Gold Analysis | #Amid Fed Rate Cut Expectation | #Cooling Inflation
On the other hand, if the price gets rejected from the 2420-2450 zone and closes below it, we might witness a bearish retracement in the coming weeks. An important point to note is that if the current month's candle closes below 2387.50, it would indicate a bearish signal. The 2387.50 level is derived from monthly frame analysis, as discussed in my previous analysis. I won't reiterate the same details to avoid redundancy.

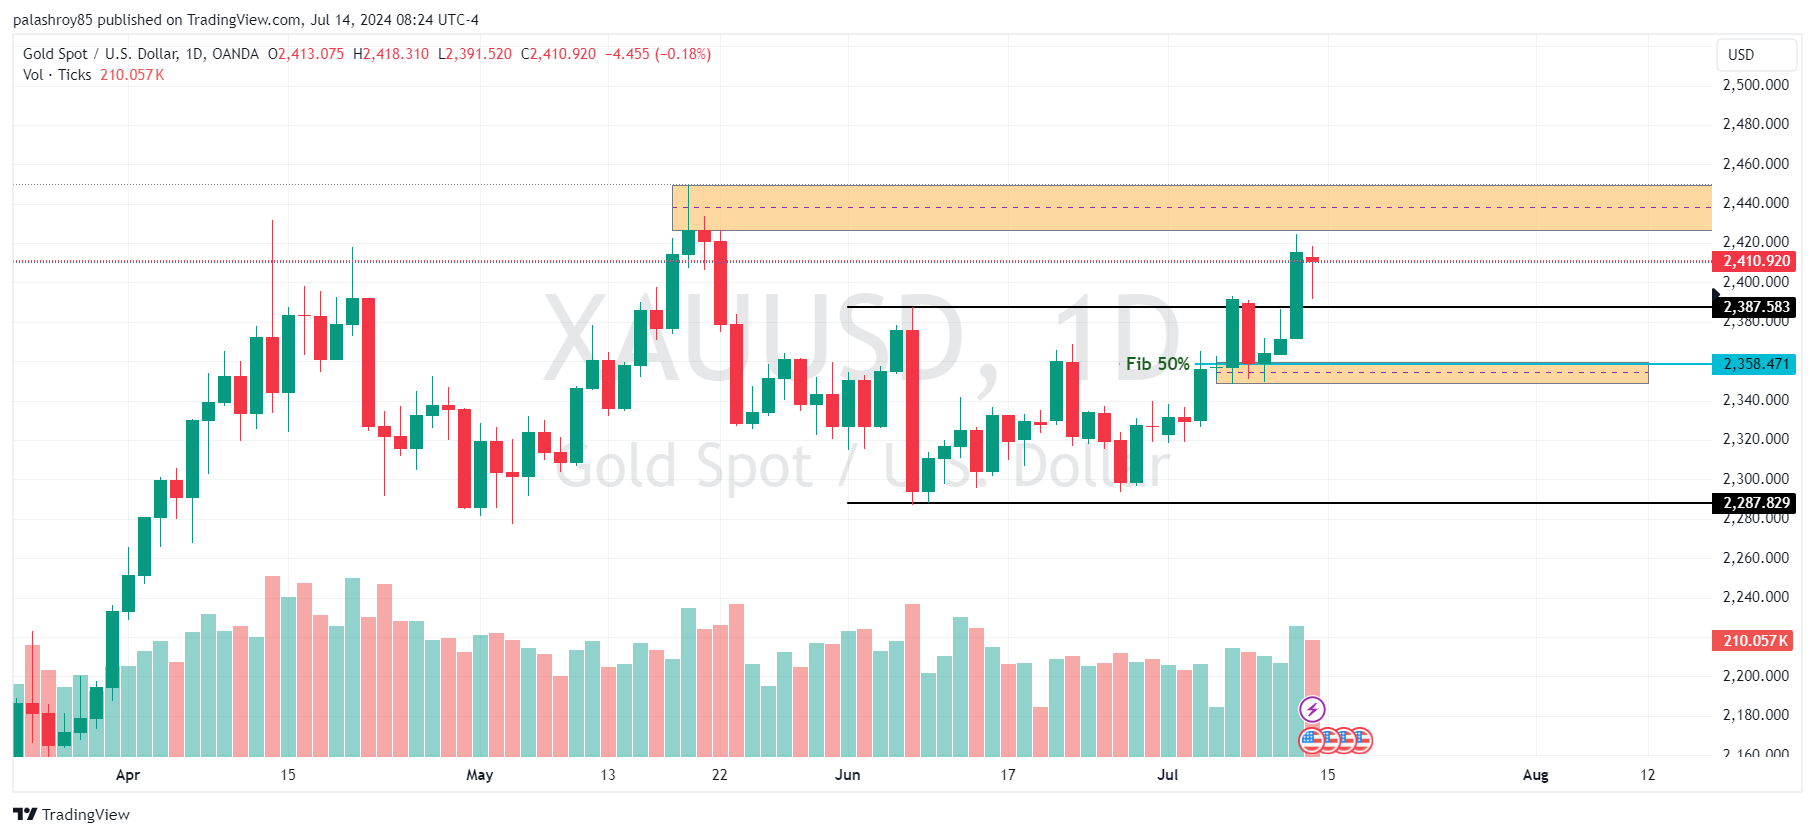
Analyzing gold on the daily time frame, we observe that the 2426-2450 zone acts as a strong resistance and is also the all-time high. If the price reaches this zone and presents bearish evidence, it could be an opportunity to initiate a sell position.
Conversely, there is strong support and demand in the 2350-2359 zone. Importantly, 2359 also represents the 50% Fibonacci retracement of the last bullish impulse. Due to these confluences, this zone is a strong buy area. If the price reaches this zone, we can look for buying opportunities, provided there is some supporting evidence.

While the weekly and daily analysis may not be directly suitable for intraday or scalping trades, understanding these higher time frame zones is crucial. If the price approaches these zones during any trading day, higher time frames should be given preference.
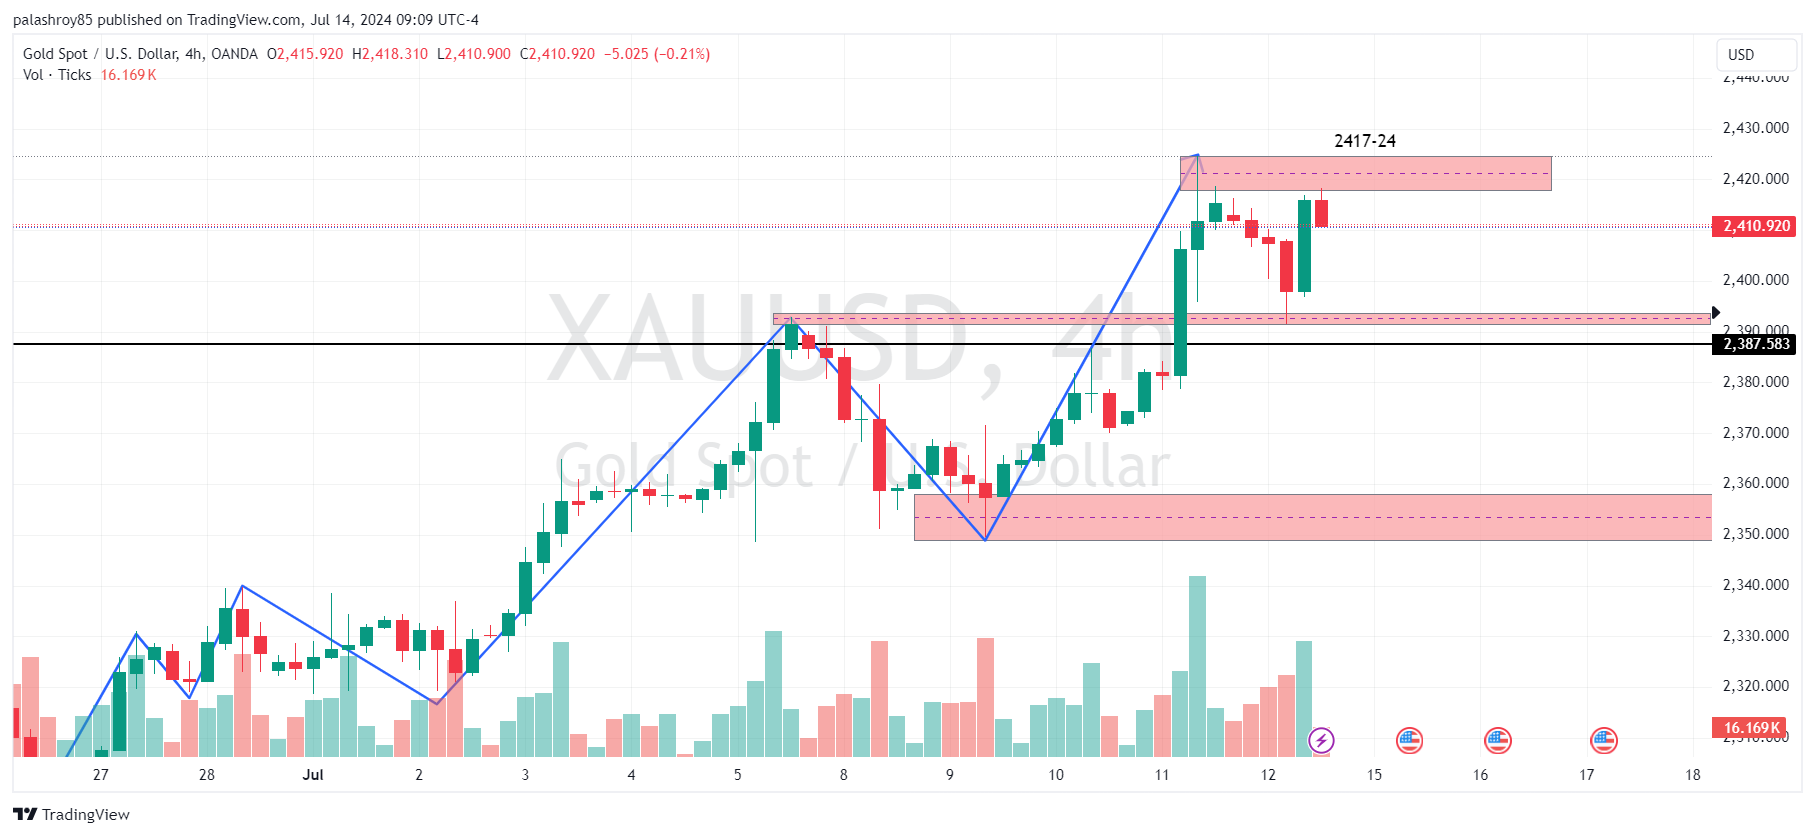
On the 4-hour chart, the market structure is clearly bullish. According to the last impulsive move, we have the first Point of Interest (POI) at 2391-2394. The price has already tested this zone and bounced back strongly. If the price returns to this zone, we can consider buying opportunities, provided there is proper evidence. However, if the price approaches this zone with momentum candles, avoid initiating a buy.
Conversely, recent market structure indicates a good resistance zone at 2417-2424. As we know, Mondays usually have slower market activity. Therefore, if the price reaches this zone before the New York session, we can initiate a sell for scalping or intraday trade purposes.

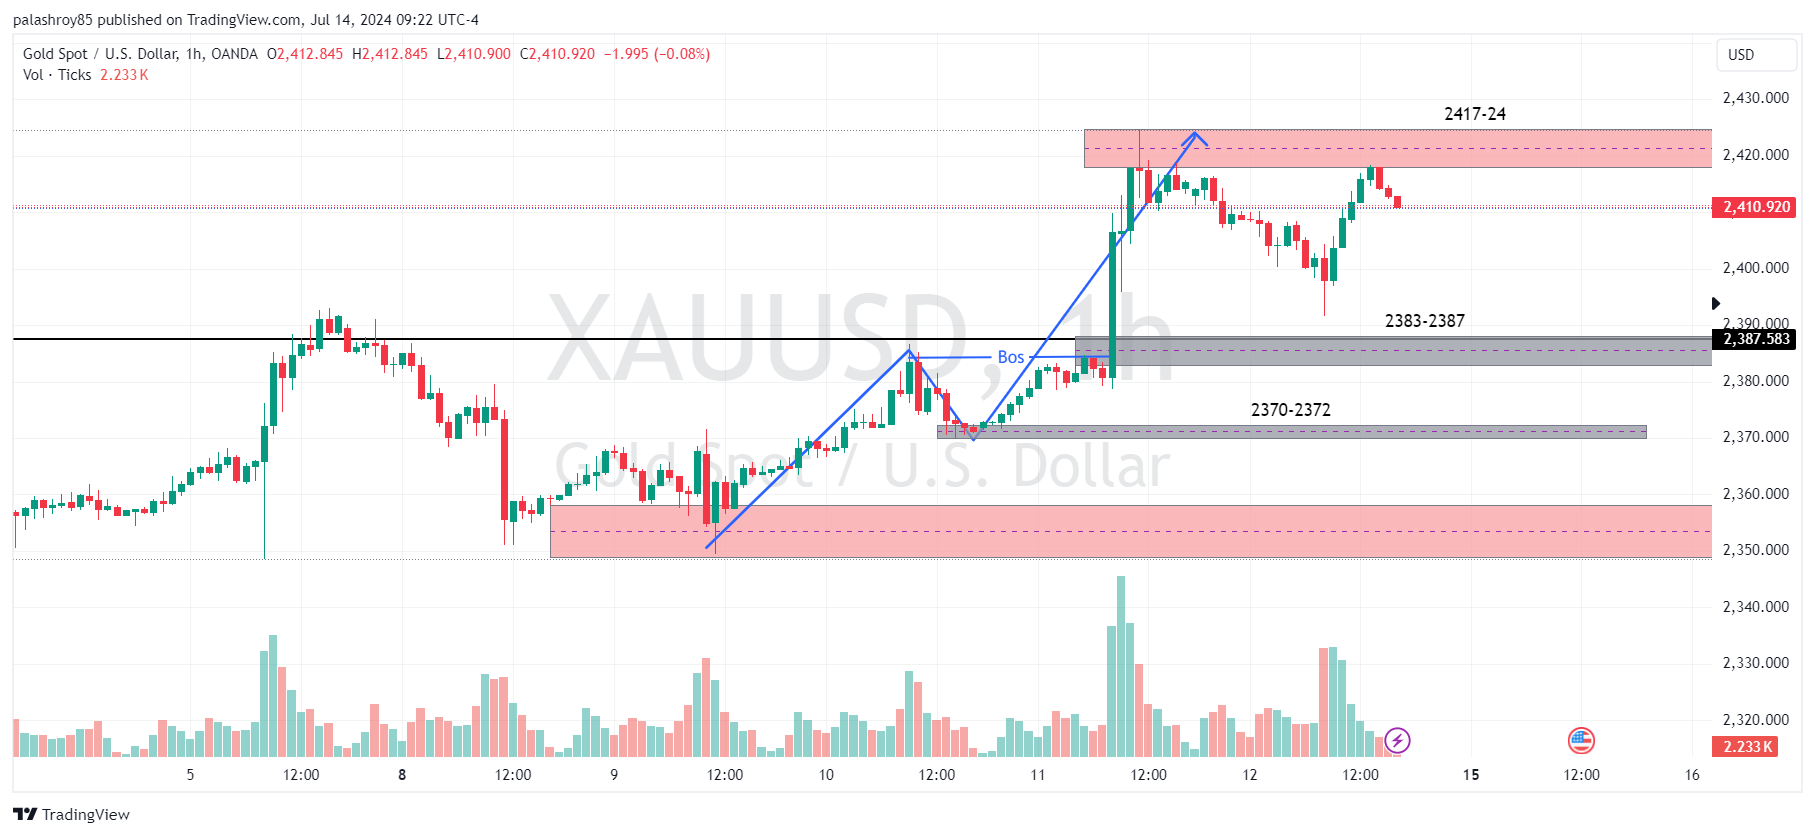
Analyzing XAUUSD on the 1-hour frame, we see that gold is in a clear bullish trend according to the market structure. Based on this advanced market structure, we have two Points of Interest (POIs) to join the current bullish trend.

This analysis provides a comprehensive outlook on XAUUSD, combining technical insights with upcoming economic data. It's essential to perform your own analysis and practice on a demo account before engaging in live trading. The market can be unpredictable, and proper preparation is crucial for success.
Stay updated with our latest analyses and insights into the Forex market. If you have any questions or suggestions, feel free to contact us or leave a comment below.
You may watch the full analysis here :
Weekly Gold Analysis | #Amid Fed Rate Cut Expectation | #Cooling Inflation
Comments