THE FOREX TRENDS
Revealing the World of Forex: Expert Analysis and Secrets of successful trading
Last Friday, the U.S. Non-Farm Payrolls (NFP) data was released, revealing an unexpected cooling down of the U.S. labor market. There was a significant increase in unemployment rates, causing a massive sell-off in gold in fear of recession. Let’s delve into the fundamental reasons behind this sell-off.
To understand the fundamental factors, you need to check all major U.S. indices and commodities. You’ll notice that there was a broad sell-off in U.S. indices and commodities last week. The primary reason behind this is the unexpectedly rising unemployment in the U.S. over the past 5-6 months, triggering a "hard landing" narrative. This means that the U.S. economy might face a recession, which cannot be ignored.
When a country experiences significantly rising unemployment alongside high-interest rates, the chances of a hard landing increase. In simple terms, this situation indicates that the Federal Reserve might cut interest rates very aggressively instead of gradually reducing them to prevent recession.
Now let’s look the technical analysis of XAUUSD for this week
The monthly candle for the previous week has closed, and gold's monthly candle closed above the previous month's high. This is significant because the previous month's candle was a doji candle. As I have discussed in my previous analysis, the doji candle strategy indicates a continuation of the bullish trend for gold.
The weekly candle also closed bullish, although there was some selling volume last Friday. This suggests we might see a minor correction in gold, but the overall trend remains bullish and dominated by buyers.
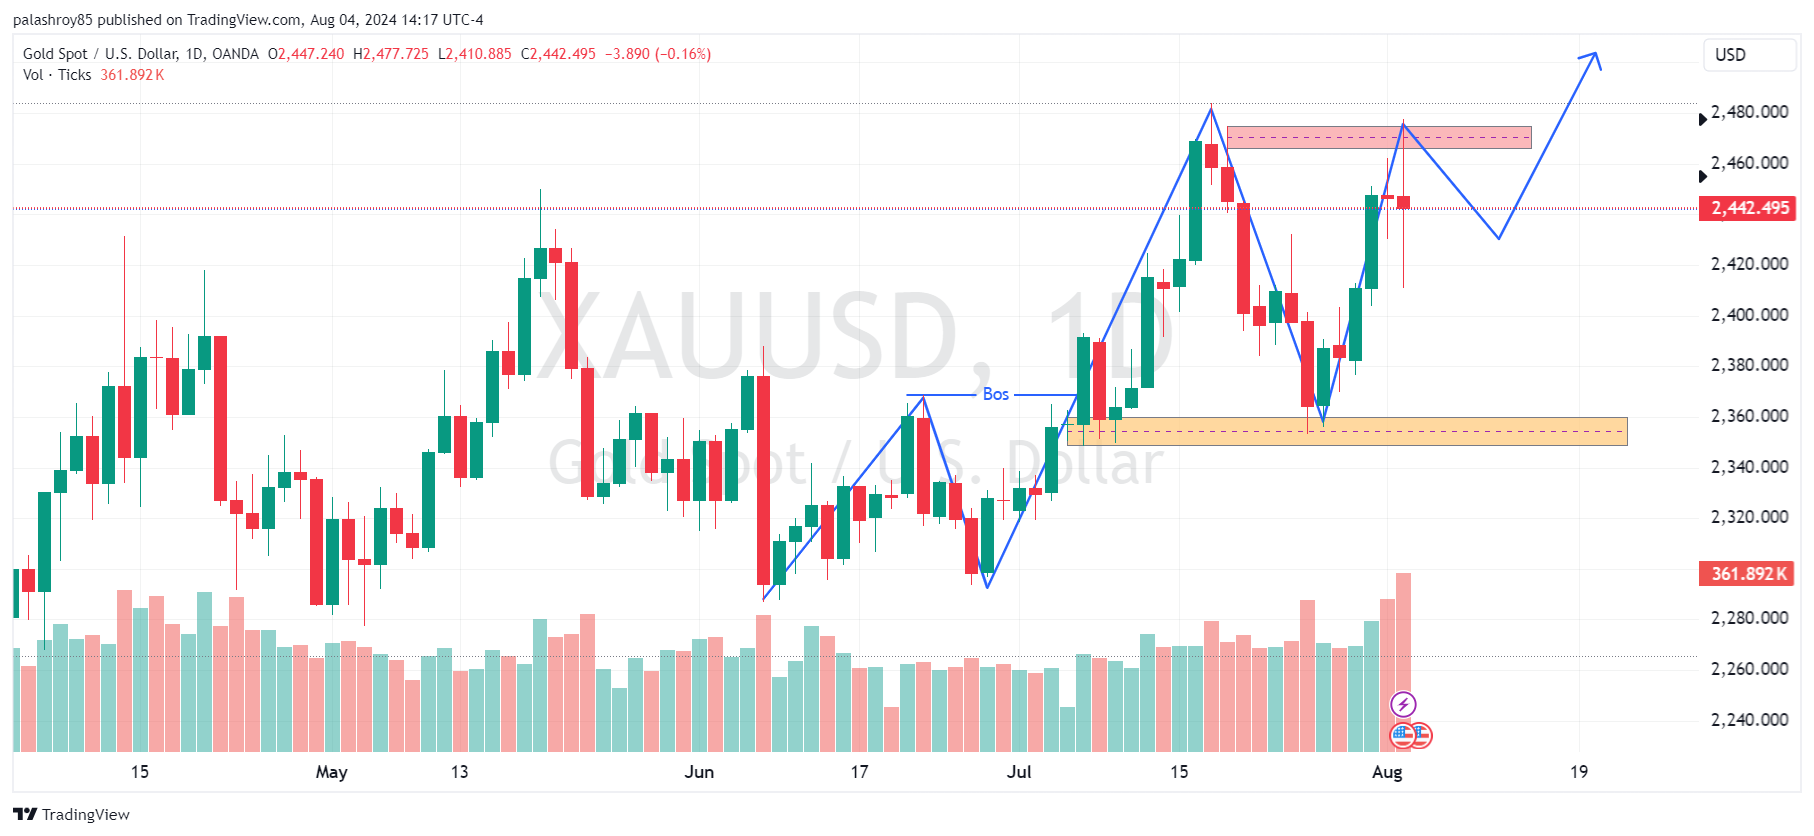
On the daily time frame, gold has created a Bullish Break of Structure (BOS) as shown in below image. The price bounced from the market structure's Point of Interest (POI) and has already hit the first target. This implies that after a few retracements, we may witness a new high in gold.

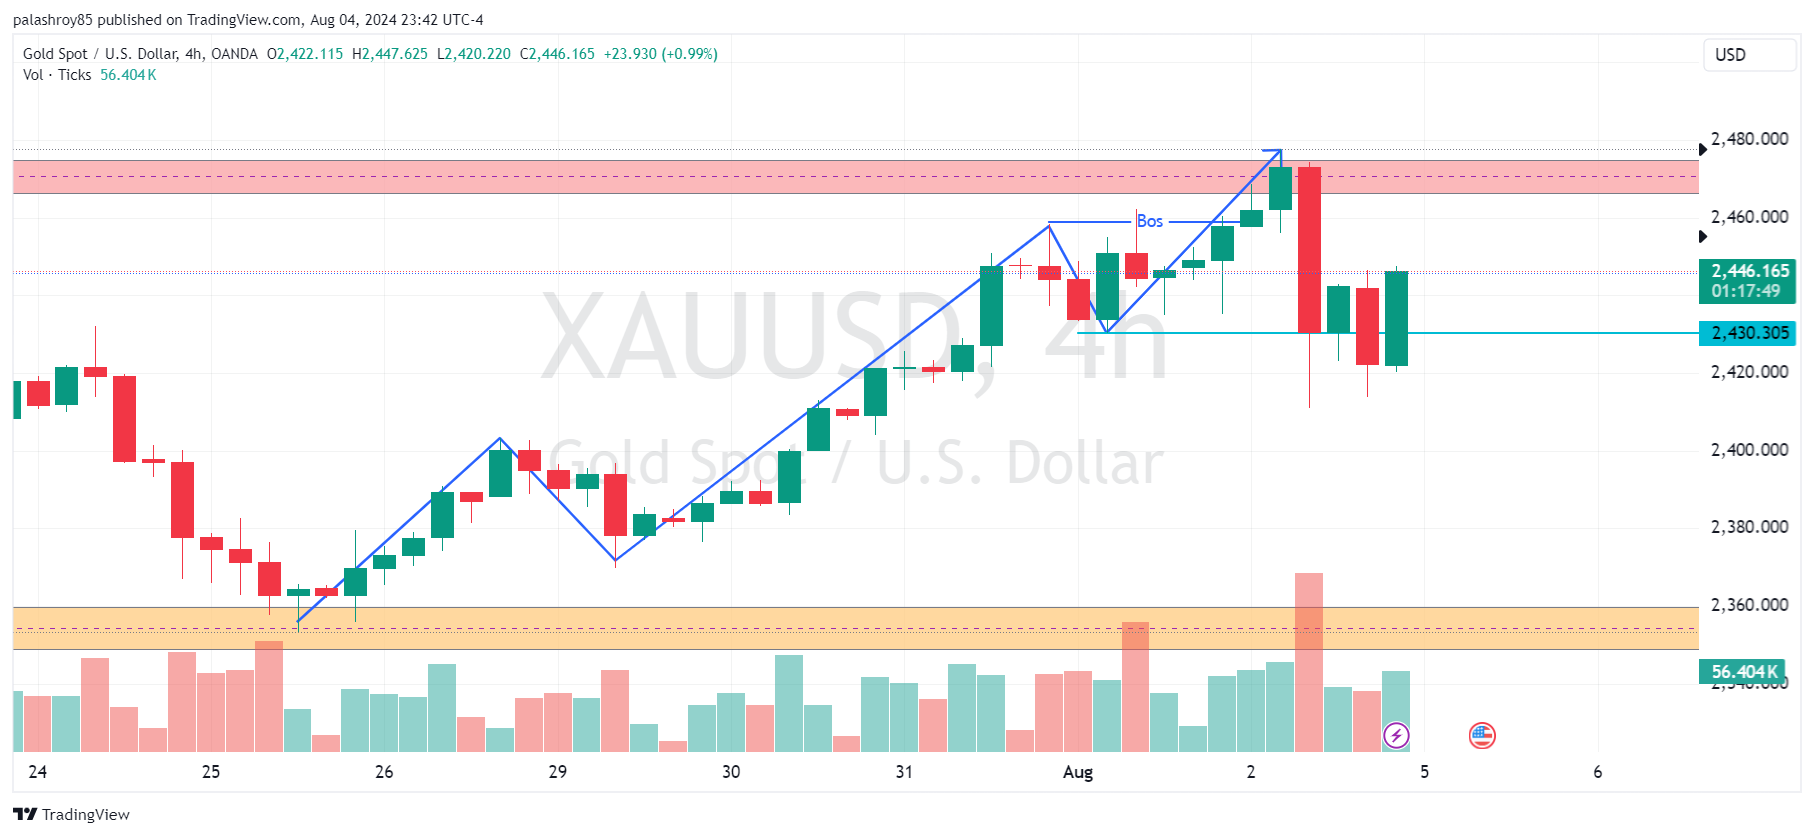
In the 4-hour time frame, gold remains bullish, consistently creating higher highs and higher lows. According to the market structure, gold has formed a Break of Structure (BOS), and there are two Points of Interest (POIs) where we can join the current bullish trend.

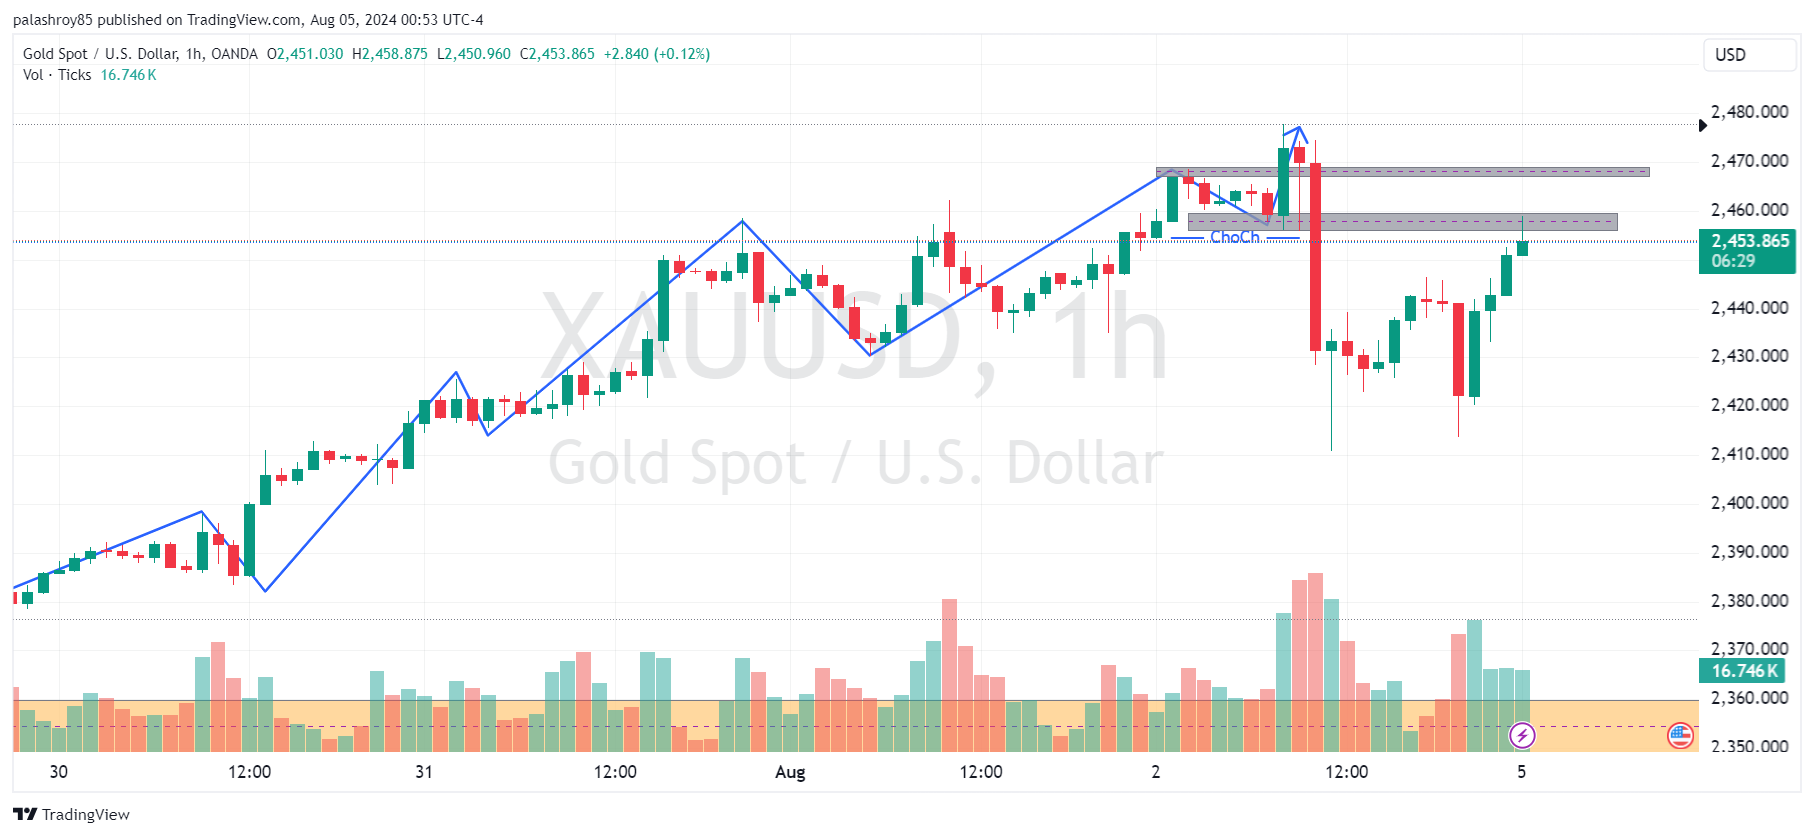
Let's analyze the 1-hour chart of XAUUSD to identify potential intraday trading opportunities.
In the 1-hour time frame, gold has formed a Change of Character (ChoCh), indicating a shift from a bullish to a bearish structure. However, it's important to note that all higher time frames are indicating a bullish market structure for gold. Therefore, selling gold may be risky, and caution is advised.

Comments